Creating Microgravity — From Free Fall to Orbit.
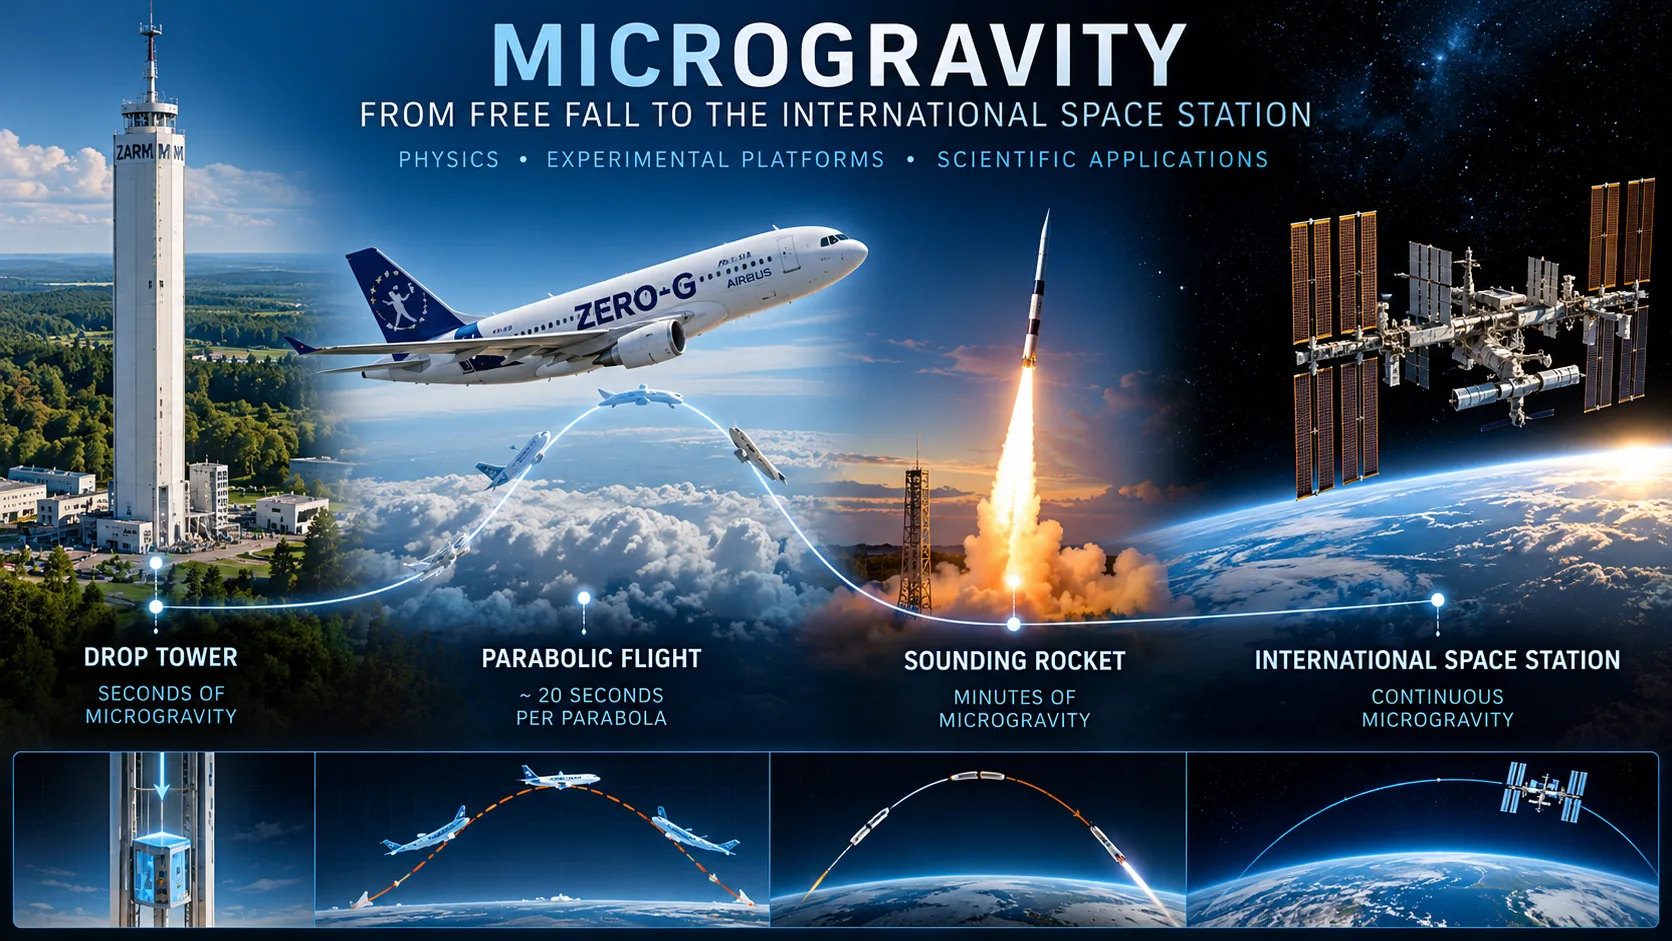
Microgravity does not mean that gravity disappears. It describes an experimental environment in which the specific force acting on a freely falling system is very small. A drop tower, a parabolic aircraft and the International Space Station (ISS) achieve this condition in different ways, but all rely on the same underlying physics: free fall.
GRAVITY IS NOT THE SAME AS APPARENT WEIGHT
In an approximately inertial reference frame, let g be the gravitational acceleration and a the acceleration of the laboratory reference point. The specific force sensed by an ideal accelerometer fixed at that point is
f = a − g.
An accelerometer at rest on Earth reads approximately 1 g0, whereas an ideal freely falling accelerometer reads zero. This does not imply that the gravitational field has vanished. For an extended laboratory, differential gravitational acceleration, rotation, vibrations and other disturbances must be treated separately.
DROP TOWER — A LABORATORY IN VERTICAL FREE FALL
The simplest realization is a capsule falling inside an evacuated tube. With the vertical coordinate z positive upwards, and neglecting drag and the height dependence of gravity, a capsule released from rest at height H follows
z(t) = H − ½g0t2; vz(t) = −g0t; az(t) = −g0.
T = √(2H/g0).
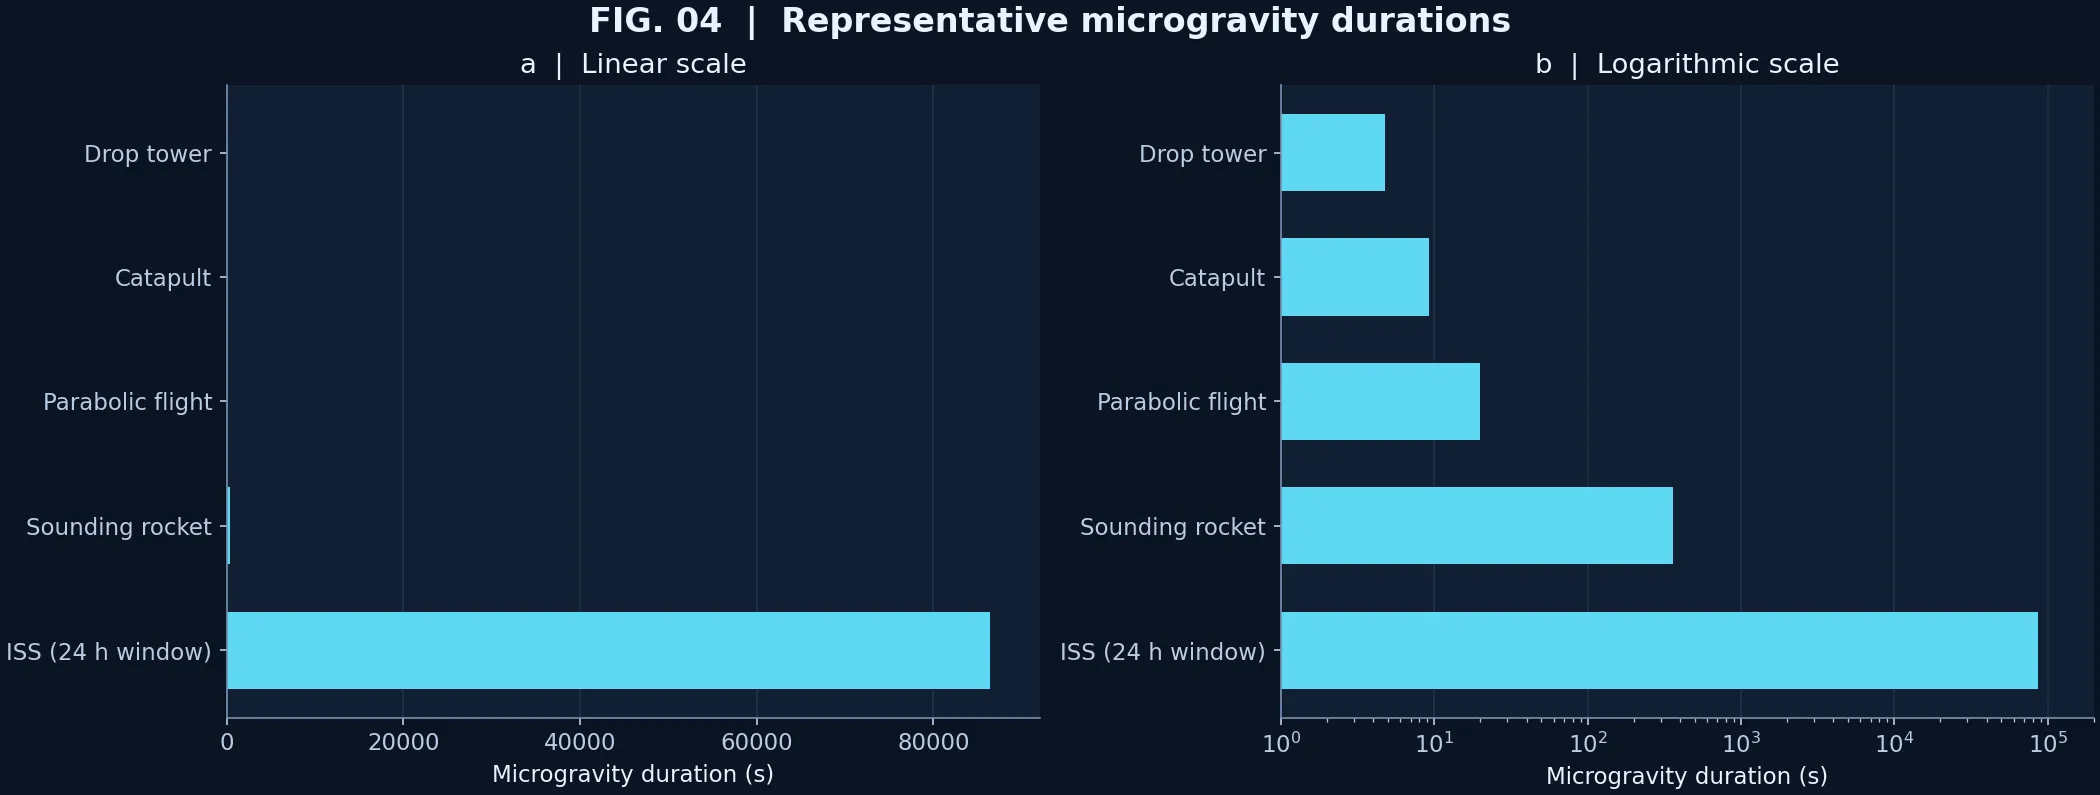
For an ideal fall distance of 110 m, this gives approximately 4.74 s. The ZARM Bremen Drop Tower provides approximately 4.7 s in drop mode and 9.3 s in catapult mode [1]. The latter launches the capsule upwards before the free-flight interval, approximately doubling the available time.
For a ballistic ascent and descent returning to the same height, the idealized duration is T = 2vz0/g0. A duration of 9.3 s would correspond to an ideal initial vertical velocity of approximately 45.6 m/s. This is a model-derived value, not a reported launch measurement.
A residual gas produces drag. In a simplified quadratic-drag model, FD = ½ρCDAv2, so the capsule experiences a non-gravitational specific force of magnitude approximately FD/m. Evacuation minimizes this contribution. Release mechanisms, vibrations and other perturbations also affect microgravity quality.
PARABOLIC FLIGHTS — A CONTROLLED BALLISTIC ARC
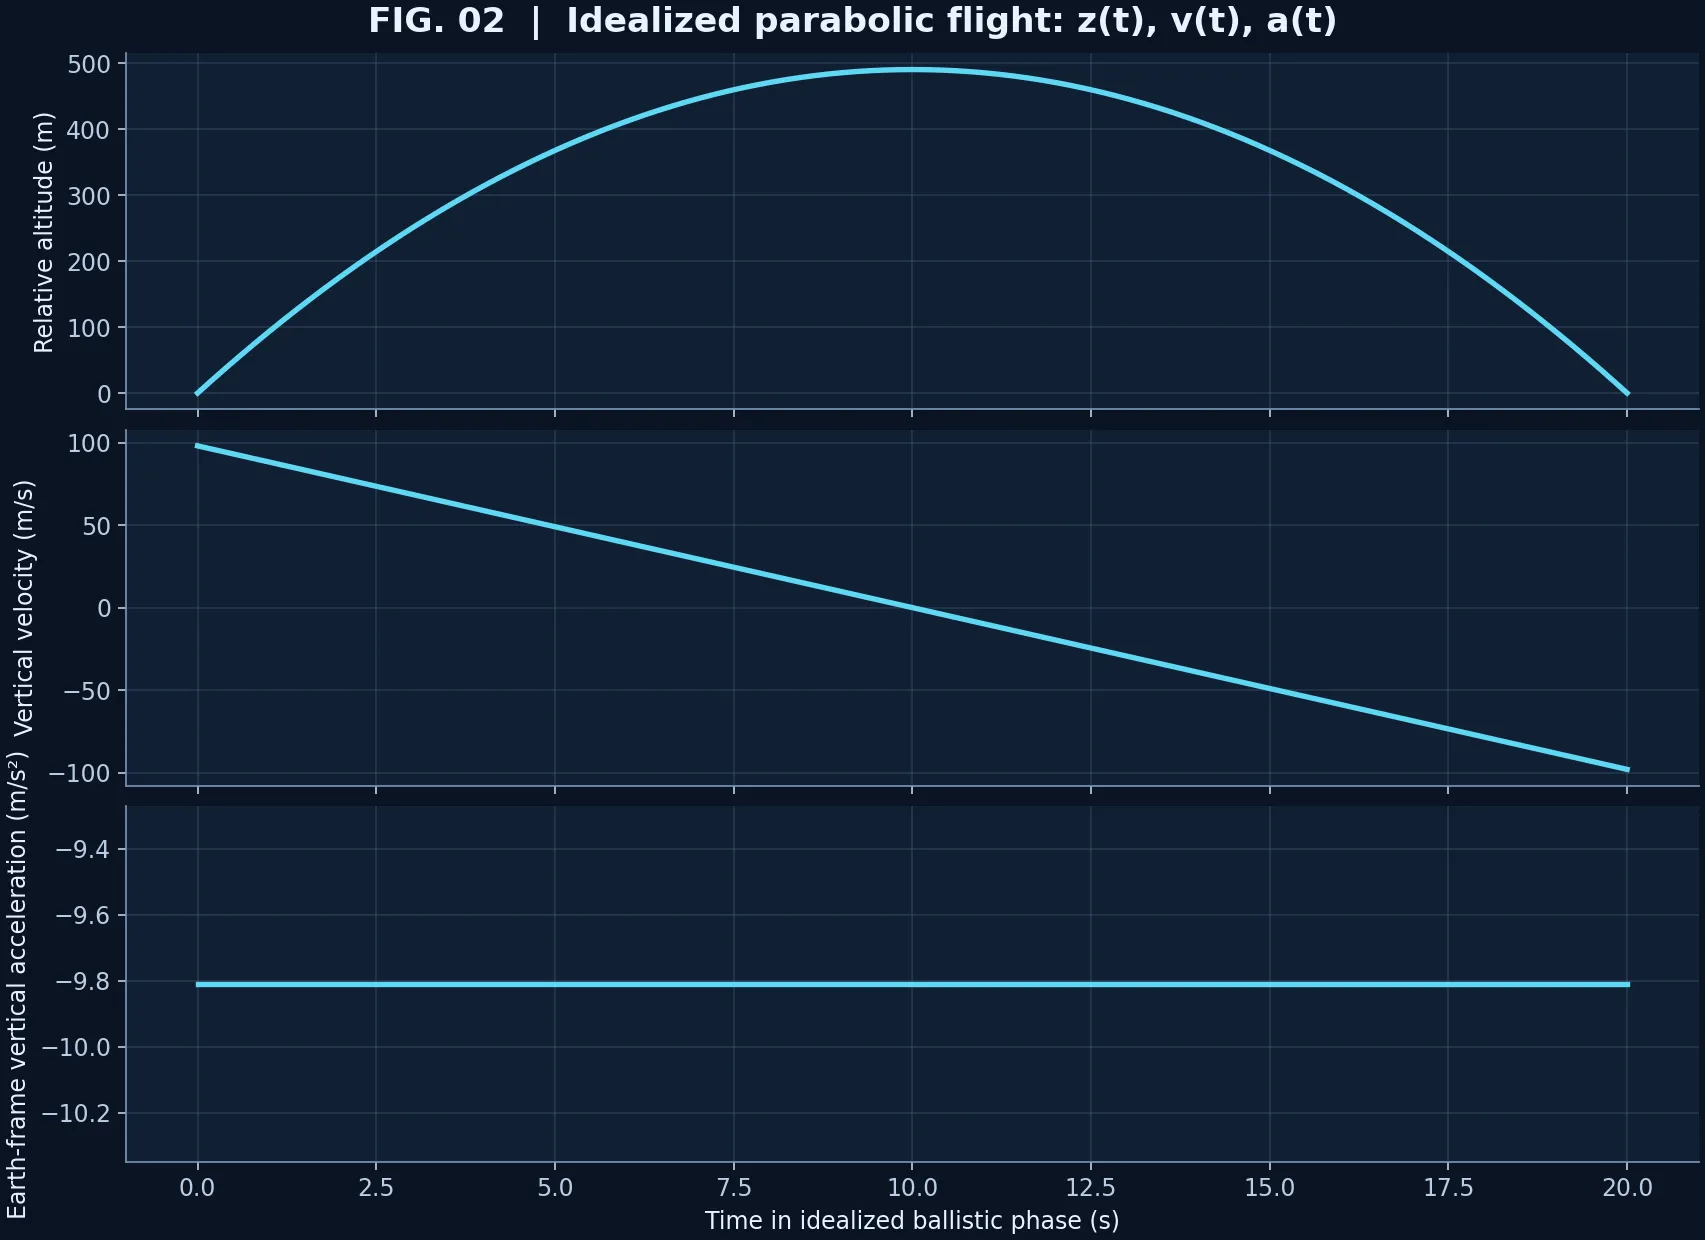
An aircraft can repeatedly enter a short interval of approximately ballistic flight. For a two-dimensional idealization with constant gravitational acceleration, initial speed v0 and initial flight-path angle θ,
x(t) = x0 + v0 cos(θ)t,
z(t) = z0 + v0 sin(θ)t − ½g0t2.
z(x) = z0 + (x − x0)tan(θ) − g0(x − x0)2 / [2v02cos2(θ)].
The mathematical parabola describes the idealized ballistic segment, not the entire aircraft maneuver. During that segment the aircraft acceleration is approximately a = g, and the accelerometer specific force f = a − g approaches zero. This is the physical reason passengers and experimental payloads experience weightlessness.
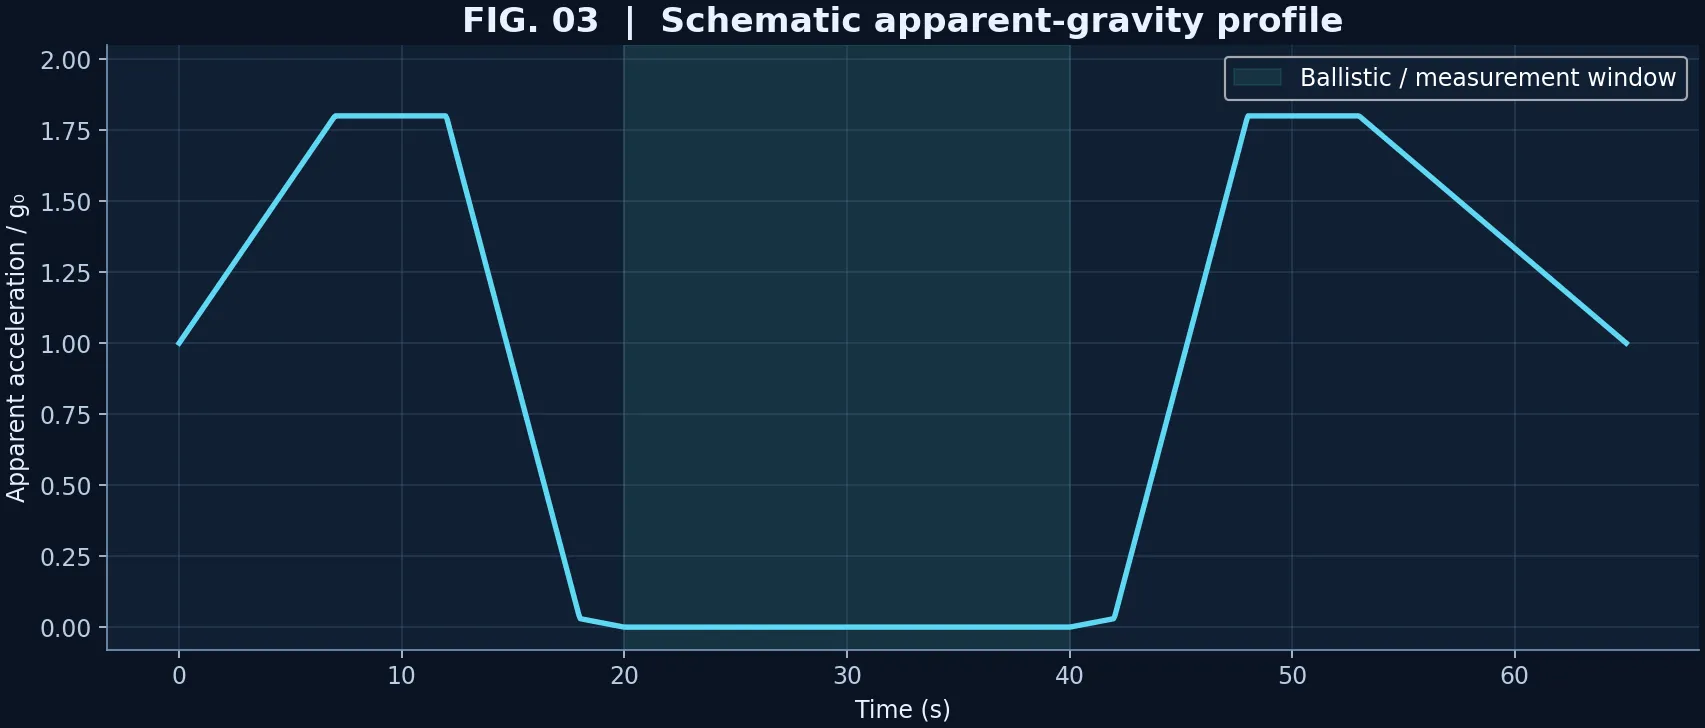
A complete parabola includes a pull-up phase, a near-ballistic interval and a pull-out phase. In typical Airbus A310 ZERO-G operations, the microgravity interval lasts roughly 20–22 seconds, while the pull-up and pull-out phases produce approximately 1.8 g0 [2].
HOW LONG CAN AN AIRCRAFT PRODUCE WEIGHTLESSNESS?
For an ideal ballistic segment starting and ending at the same altitude, its duration depends on the initial vertical velocity:
Tμg ≈ 2vz0/g0 = 2v0sin(θ)/g0.
The following comparison combines an operationally documented aircraft with illustrative ballistic estimates. The estimates are not certified aircraft capabilities, and no historical Concorde microgravity mission is asserted.
| Aircraft / vehicle | Assumed vz0 | Microgravity per parabola | Status |
|---|---|---|---|
| Cessna (generic light aircraft) | 25–50 m/s | ≈ 5–10 s | Illustrative estimate only |
| Airbus A310 ZERO-G | Not inferred from duration | ≈ 20–22 s | Documented typical operation [2] |
| Concorde | 100–150 m/s | ≈ 20–31 s | Hypothetical model only; not demonstrated operation |
| Star Trek shuttlecraft | 150 m/s | ≈ 30.6 s | Fictional theoretical example |
For the estimates, vz0 is a chosen initial vertical velocity, not an independently established flight parameter. Aerodynamic forces, available altitude, aircraft operating limits and flight control may make these idealized scenarios infeasible. The fictional shuttlecraft is included as a playful illustration of the physics, not as an engineering specification.
The effective acceleration experienced by an experiment also depends on its position and motion in the aircraft. In a rotating cabin frame, Coriolis, centrifugal and Euler terms can contribute to relative acceleration. A low accelerometer reading at one location does not guarantee identical conditions throughout the cabin.
INTERNATIONAL SPACE STATION — CONTINUOUS ORBITAL FREE FALL
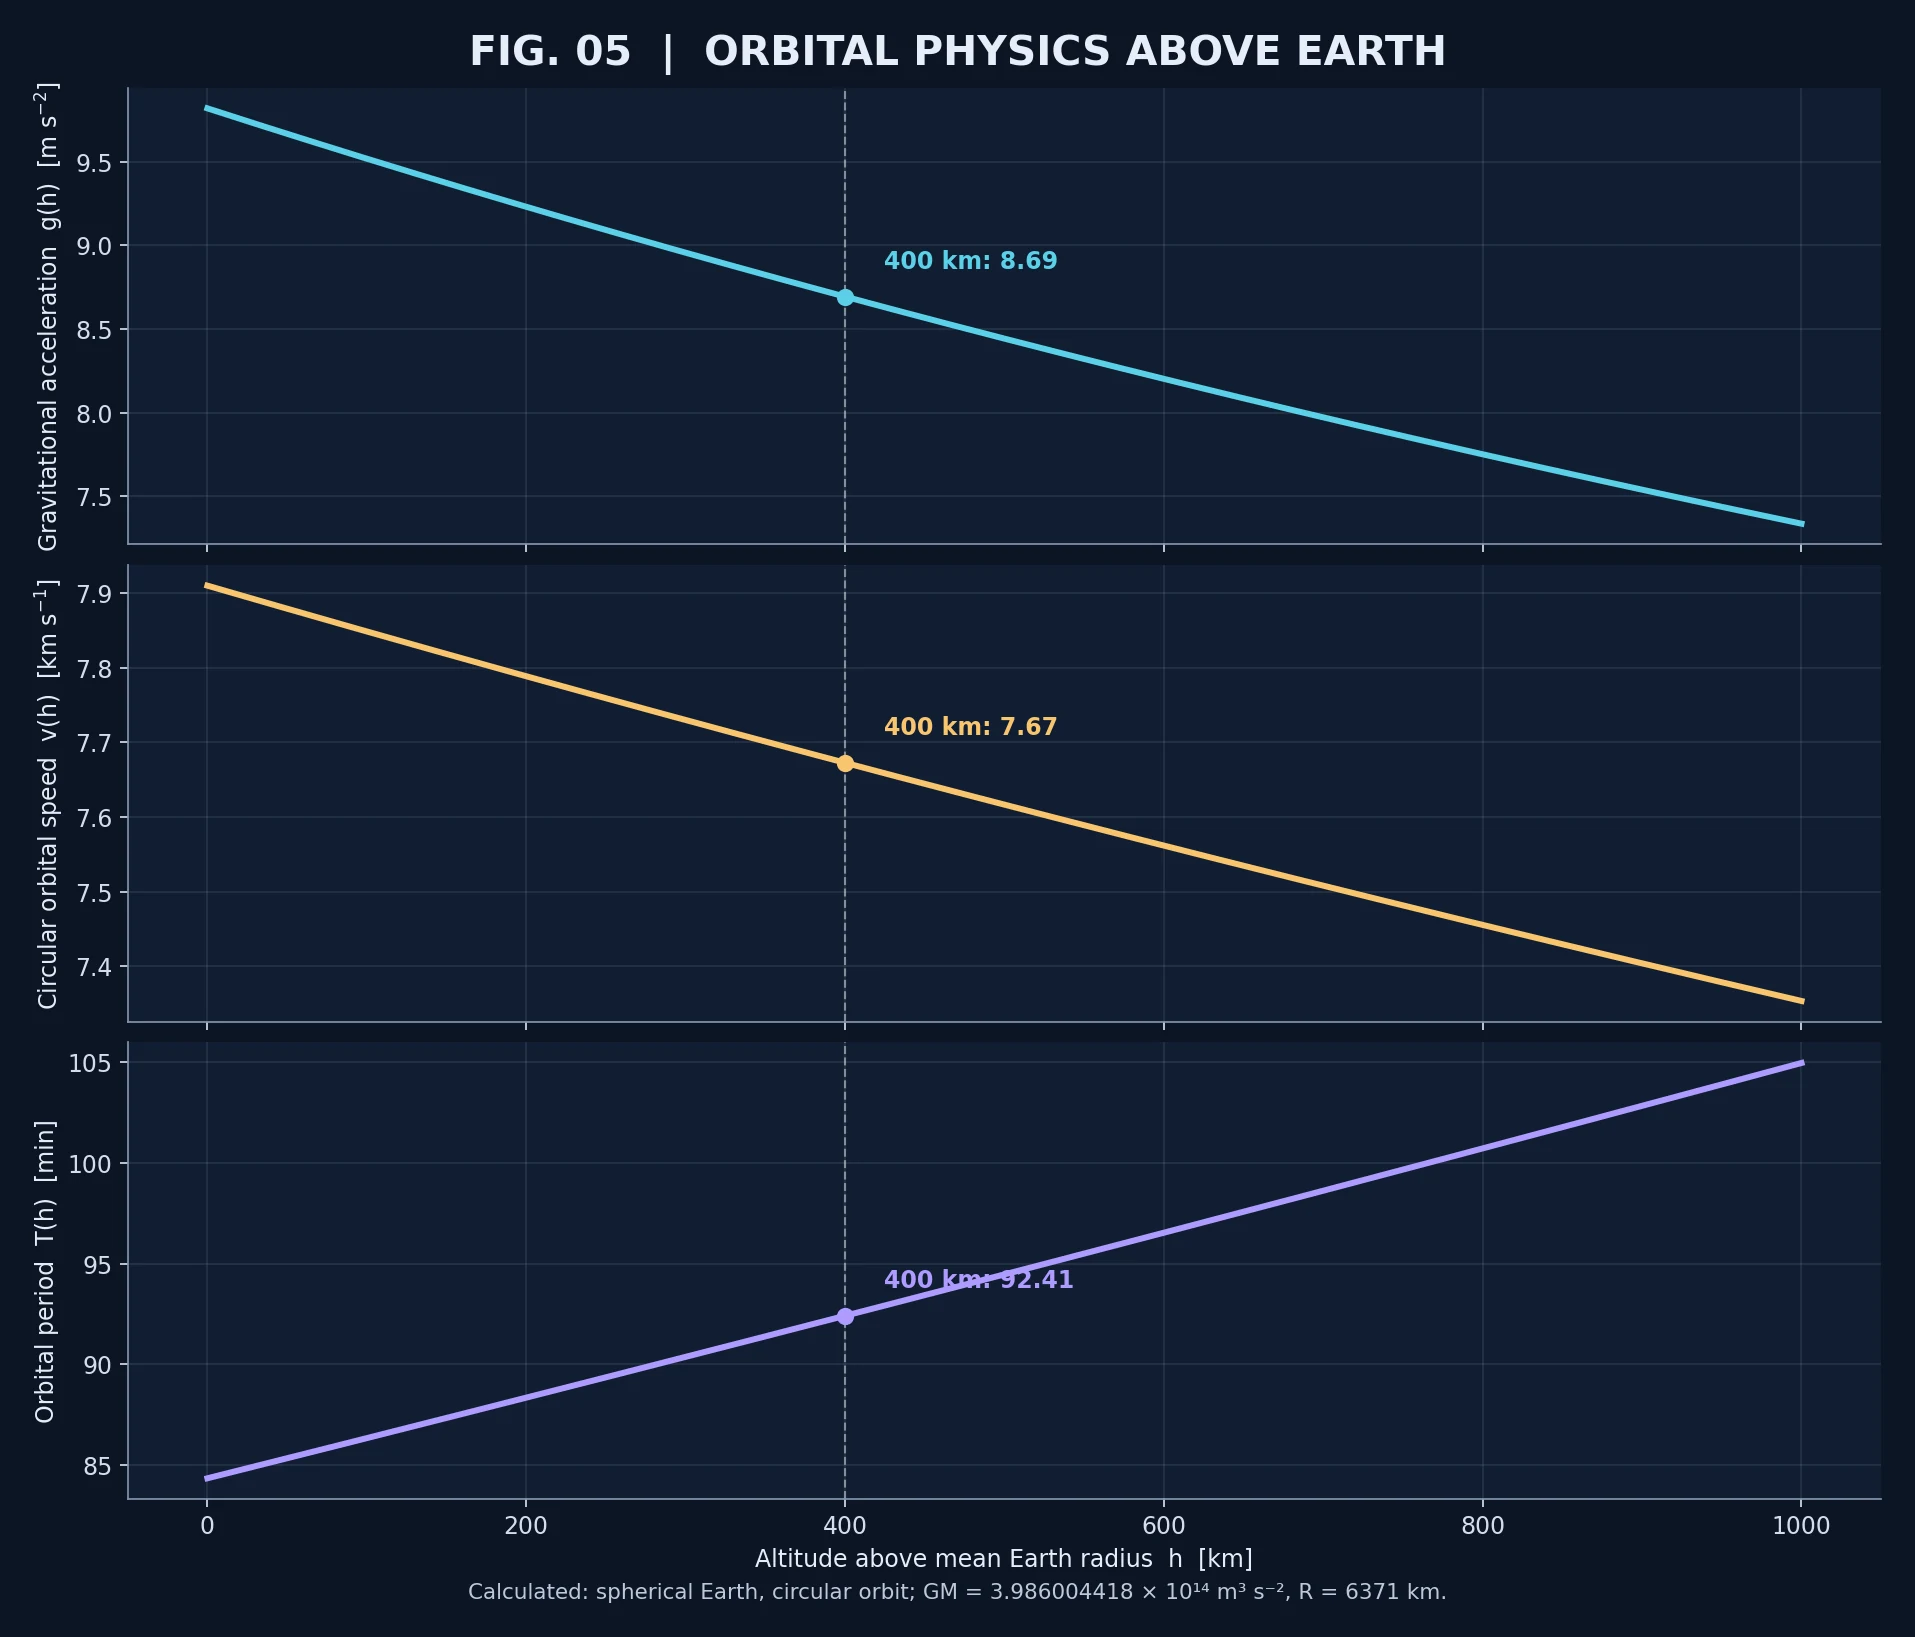
The ISS is not beyond Earth’s gravitational field. In a spherical-Earth approximation, at altitude h,
g(h) = GM⊕ / (R⊕ + h)2.
At a representative altitude of 400 km, the gravitational acceleration is approximately 8.69 m/s² — about 89% of its surface value. Astronauts float because they and the station are falling around Earth together, not because gravity has become negligible [3].
For an ideal circular orbit of radius r = R⊕ + h, gravitational acceleration provides the required centripetal acceleration:
vorb = √(GM⊕/r); Torb = 2π√(r3/GM⊕).
At 400 km these expressions give approximately 7.67 km/s and 92.4 minutes, respectively. The station is continuously deflected by Earth’s gravity while its tangential motion carries it around the planet.
GRAVITY GRADIENTS — WHY FREE FALL IS NOT PERFECTLY UNIFORM
A single freely falling reference point can have zero ideal specific force, but a laboratory has finite dimensions. Let R be the position of its reference point and ξ the displacement of a nearby test mass. The difference in gravitational acceleration is, to first order,
δgi ≈ Σj Γij ξj, Γij = ∂gi/∂xj.
For a point-mass Earth, the gravity-gradient tensor is
Γij = (GM⊕/R3)(3ninj − δij).
In a local non-rotating freely falling frame, the radial eigenvalue is +2GM⊕/R³, while each transverse eigenvalue is −GM⊕/R³. This corresponds to radial tidal stretching and transverse compression of nearby free test masses.
At 400 km, GM⊕/R³ ≈ 1.28 × 10⁻⁶ s−2. Two ideal freely falling test masses separated radially by 10 m would therefore have a differential gravitational acceleration of approximately 2.56 × 10⁻⁵ m/s². This is a calculated tidal differential, not a universal onboard residual-acceleration reading.
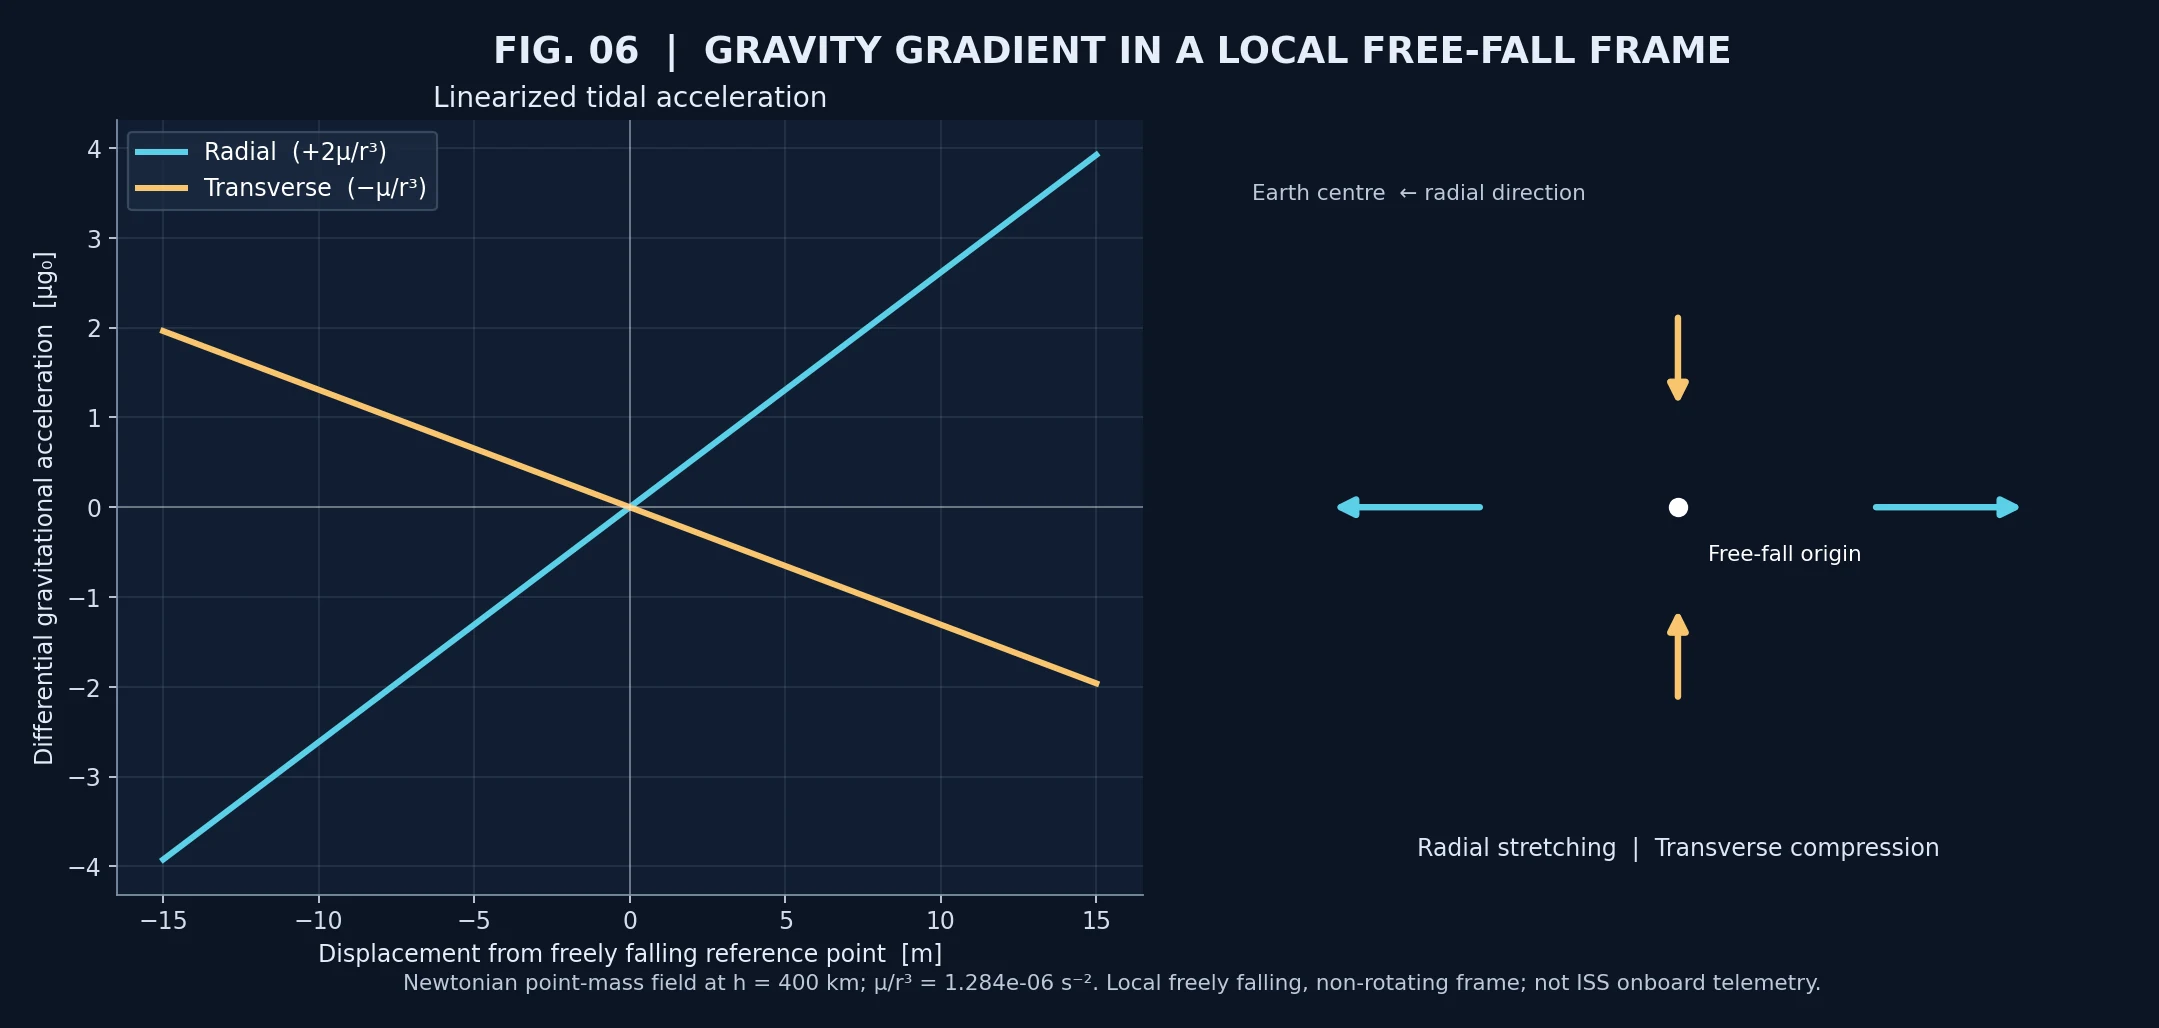
In the station-fixed rotating frame, centrifugal, Coriolis and Euler contributions must be included when relevant. The real microgravity environment is also affected by aerodynamic drag, station maneuvers, mechanical vibrations, onboard equipment and crew activity. The disturbance spectrum and the experiment’s location matter [4].
COMPARING MICROGRAVITY PLATFORMS
Duration is only one experimental parameter. A short, quiet microgravity interval may be more suitable for a particular measurement than a longer interval containing significant disturbances. Relevant descriptors include residual specific force, relative acceleration, their frequency spectra and the characteristic response time of the investigated system.
| Platform | Representative duration | Dominant constraints |
|---|---|---|
| Drop tower | ≈ 4.7 s; catapult ≈ 9.3 s | Short observation window, launch/recovery, residual gas |
| Parabolic aircraft | ≈ 20–22 s per parabola | Transitions to hypergravity, aerodynamic and rotational disturbances |
| ISS | Extended orbital operations | Vibration, gradients, station maneuvers, experiment location |
MICROGRAVITY RESEARCH IN PRACTICE
Microgravity can substantially reduce sedimentation, buoyancy-driven flow and hydrostatic pressure gradients. This creates opportunities to isolate physical processes that are masked by gravitational effects on Earth. However, interpreting measurements requires knowledge of the actual acceleration environment and the timescales of the investigated system.
Further reading — Electrical Impedance Measurements During Parabolic Flights. A separate E-TWIN article will examine the physical motivation, experimental setup and interpretation of electrical impedance experiments carried out during parabolic flights. This future article will distinguish experimental participation from authorship of the related scientific publications.
REFERENCES AND FURTHER READING
[1] ZARM, University of Bremen — Research facilities and Drop Tower.
[2] European Space Agency — Airbus A310 ZERO-G.
[3] NASA Glenn Research Center — What Is Microgravity?
[4] NASA Technical Reports Server — ISS microgravity acceleration environment.