From Excimer Gas to Modern Displays — The Physics of Industrial XeCl Laser Annealing
A modern display begins long before its pixels emit or modulate light. One enabling step in many high-performance thin-film transistor (TFT) manufacturing routes is the controlled transformation of an initially amorphous silicon film into polycrystalline silicon. Industrial excimer lasers can supply the necessary energy in a short ultraviolet pulse while limiting heat diffusion into the underlying glass.
This article follows the chain from the transient XeCl* molecule and its 308 nm photon, through discharge stability and beam homogenization, to laser-induced melting, solidification, transistor switching and the finished display. It is a physics-oriented overview, not a proprietary process recipe or an exact description of any individual commercial machine.
1. WHY AN EXCIMER LASER?
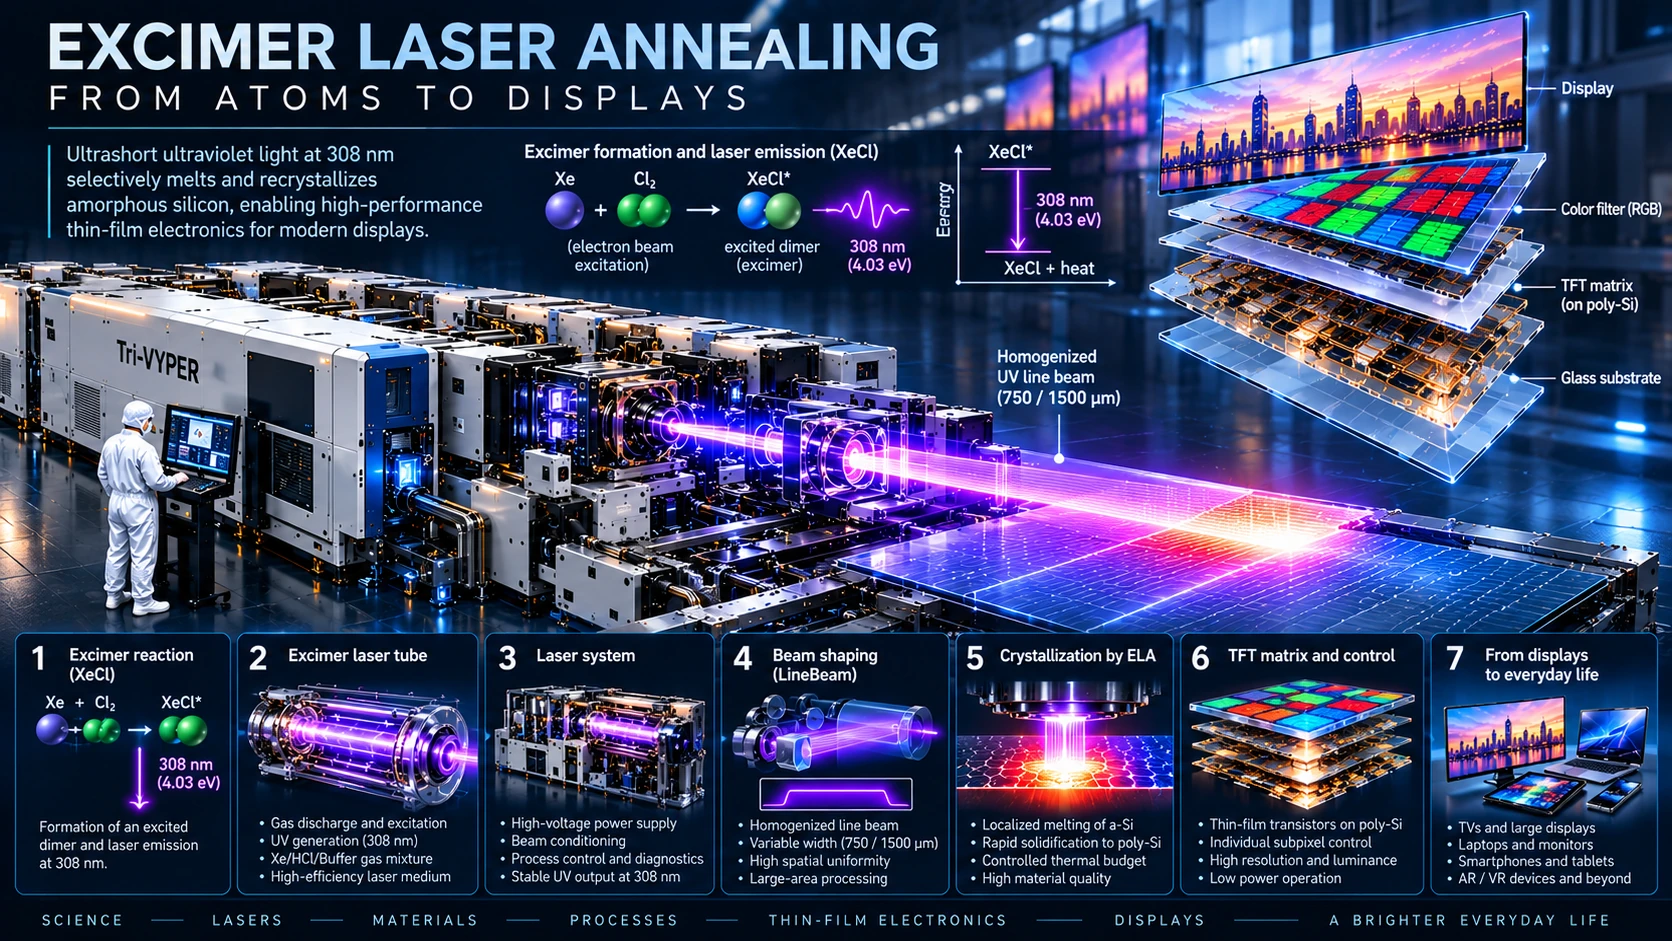
An excimer laser is not simply a bright ultraviolet lamp. It is a pulsed gas laser whose gain medium contains short-lived excited molecular states. In the XeCl system, the lasing species is an excited xenon chloride exciplex, conventionally written XeCl*. The excited bound state and the weakly bound or repulsive lower state permit strong stimulated emission at approximately 308 nm.
Eγ = hν = hc/λ ≈ 4.03 eV (λ = 308 nm).
The short wavelength is absorbed efficiently by thin silicon films, and nanosecond-scale energy delivery can produce rapid heating. High average power and pulse energy matter because a large glass substrate must be processed with reproducible fluence, not merely illuminated.
2. THE XeCl* REACTION: FORMATION, EMISSION AND LOSS
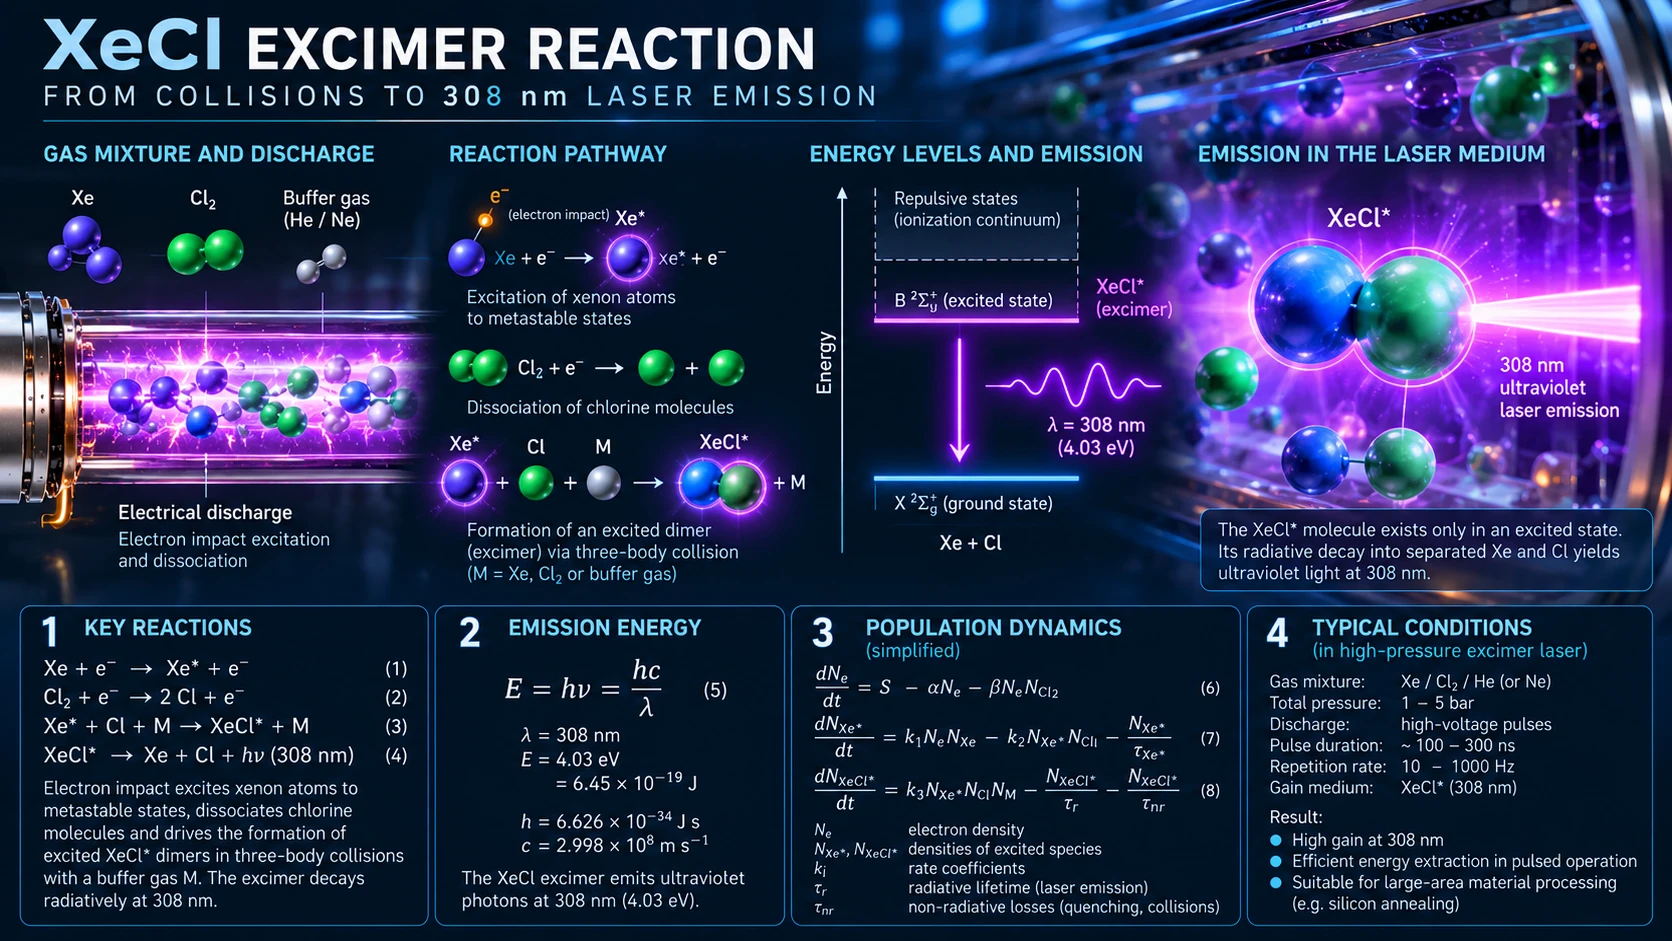
The actual discharge chemistry is a network of electron-impact excitation, ionization, attachment, ion–ion reactions, collisional quenching and gas transport. A schematic representation of the useful pathway is
Xe + energy → Xe*; Xe* + chlorine-containing species → XeCl*;
XeCl* → XeCl + hν (λ ≈ 308 nm).
These expressions describe the idea, not a balanced elementary reaction mechanism. Industrial XeCl mixtures commonly contain xenon, a chlorine donor such as HCl and a buffer gas; the dominant microscopic production routes depend on pressure, mixture composition and discharge conditions. In particular, it would be incorrect to read a simple “Xe + Cl₂” cartoon as the unique elementary laser reaction.
dNu/dt = Rform − Nu/τrad − kqNunq − Rstim,
Here Nu denotes the excited-state population density, Rform its formation rate, τrad a radiative lifetime, and the quenching term represents collisional losses. A useful laser pulse requires gain to exceed resonator and other optical losses during the short discharge interval.
g(ν,t) = σe(ν)Nu(t) − σa(ν)Nl(t); gnetL > losses.
The gain relation is deliberately simplified: the spectral cross sections, lower-state occupation and distributed optical losses depend on the laser architecture.
3. INSIDE THE DISCHARGE TUBE
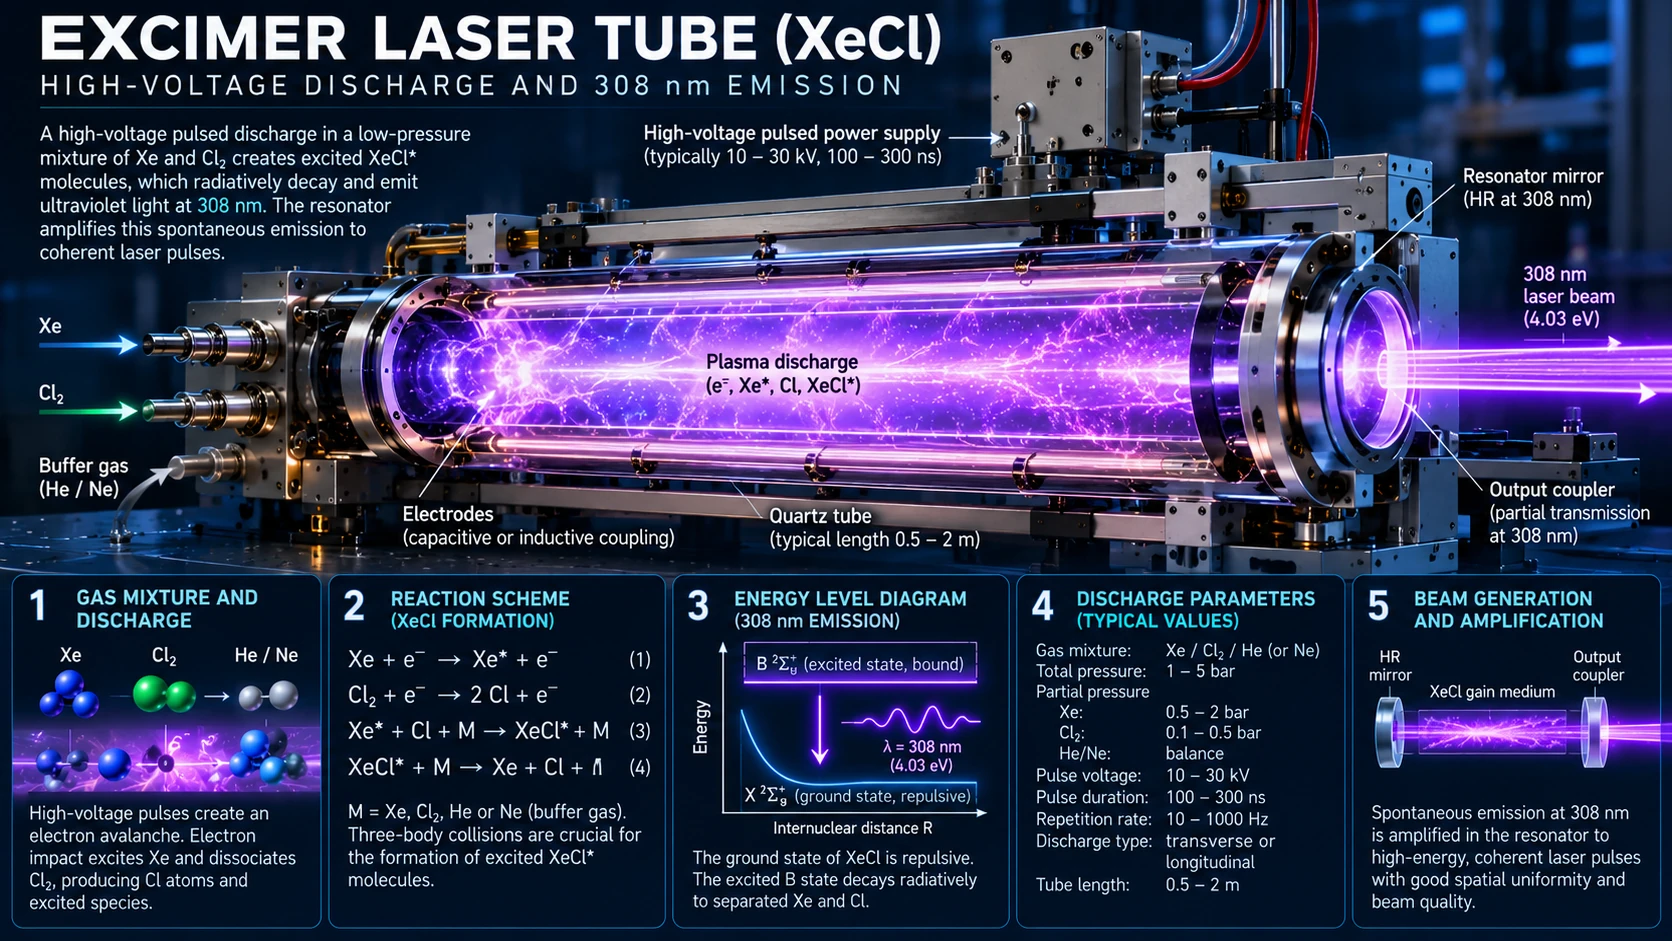
A high-voltage pulser delivers electrical energy to an electrode arrangement across the gas volume. The resulting transient discharge must remain spatially uniform: localized arcs concentrate energy, damage electrodes and windows, and produce pulse-to-pulse fluctuations. Preionization and carefully controlled pulse formation help initiate a sufficiently homogeneous discharge.
Pel(t) = U(t)I(t), Eel,pulse = ∫U(t)I(t)dt.
Gas circulation and heat exchangers remove deposited heat and distribute reaction products. Pressure, mixture composition, temperature, discharge uniformity and optical-window transmission all influence stability. The transparent tube shown in the figure is a pedagogical cutaway: real laser chambers are not transparent vessels revealing luminous gas dynamics.
ρcp(∂T/∂t + v·∇T) = ∇·(k∇T) + q̇discharge,
This schematic heat-transport equation shows why gas flow and cooling belong to laser physics rather than merely to the mechanical periphery. Detailed discharge modelling also requires charged-particle transport, reaction kinetics and electric-field coupling.
4. PULSE ENERGY, AVERAGE POWER AND STABILITY
For a pulse train with repetition rate f, the optical average power is determined by the energy per pulse, not by the peak power alone.
Pavg = Epulse f; Ppeak ≈ Epulse/τpulse.
For example, 600 W at 600 Hz corresponds to approximately 1 J per pulse. Six synchronized 600 W sources would provide a combined nominal 3.6 kW average optical power and 6 J per synchronized pulse, before downstream optical losses. These numbers illustrate a possible industrial operating point; they are not a universal specification for every VYPER configuration.
Etotal = Σi=1NEi, Ptotal = fΣi=1NEi.
Energy reproducibility, pulse timing, pointing, spatial profile and long-term drift matter at least as much as the nominal total wattage. For synchronized channels, a relative timing mismatch Δt must be assessed against the pulse duration and the temporal response of the target process. The often-quoted nanosecond timing precision is a control challenge, not a claim that all beams are mutually phase coherent.
5. FROM A ROUGH LASER BEAM TO A CONTROLLED LINE
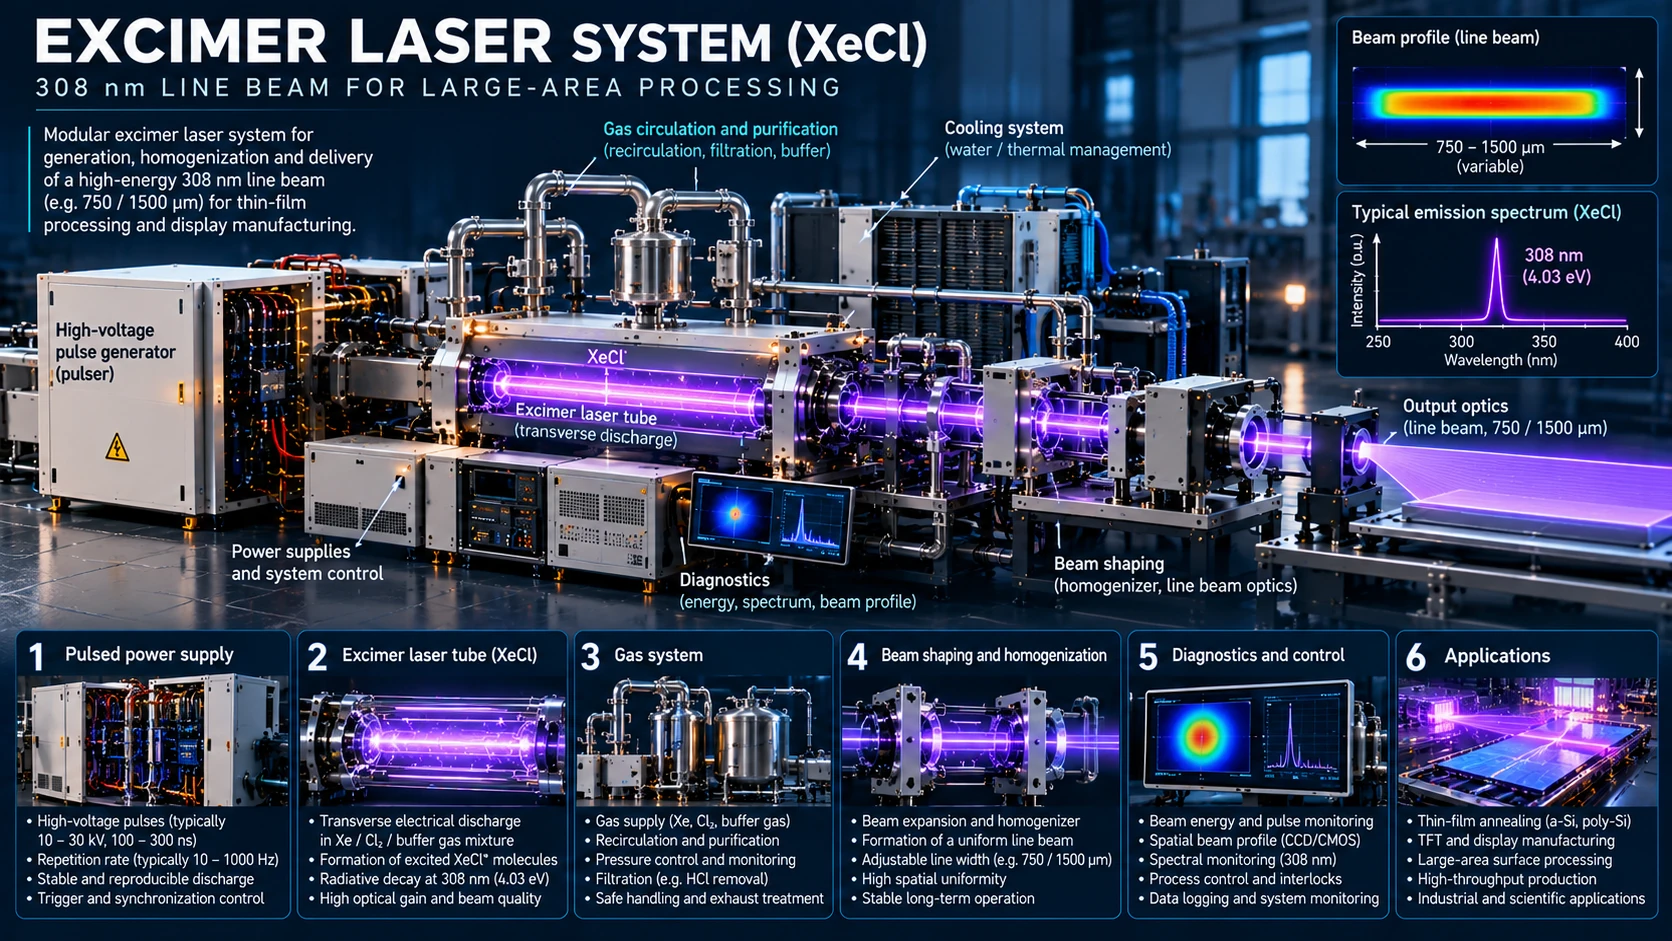
A raw excimer beam is not a diffraction-limited Gaussian beam. It can exhibit spatial nonuniformity, divergence, pointing variations and limited spatial coherence. The industrial task is to transform this beam into a long, narrow illumination line with an appropriate intensity distribution along both axes.
F(x,y) = ∫ I(x,y,t)dt; F̄ = Eline/Ailluminated.
Homogenizing optics redistribute the input field. A simplified measure of uniformity along the line is the relative standard deviation
CVF = σF/⟨F⟩.
Real acceptance criteria may use peak-to-valley variation, local-window metrics or process-specific tolerances. Beam-analysis cameras and optical diagnostics distinguish near-field distributions from far-field angular information. The near-field images previously discussed in this project must not be mislabeled as far-field measurements.
Controlled motion of optical elements can average residual interference-like or structured nonuniformities across successive exposures. Such “micro-smoothing” is a dynamic process-control technique; its usefulness depends on scan speed, repetition rate, vibration amplitude and the material response, and cannot be inferred from an artistic picture alone.
6. LINEBEAM AND MULTI-SOURCE ARCHITECTURES
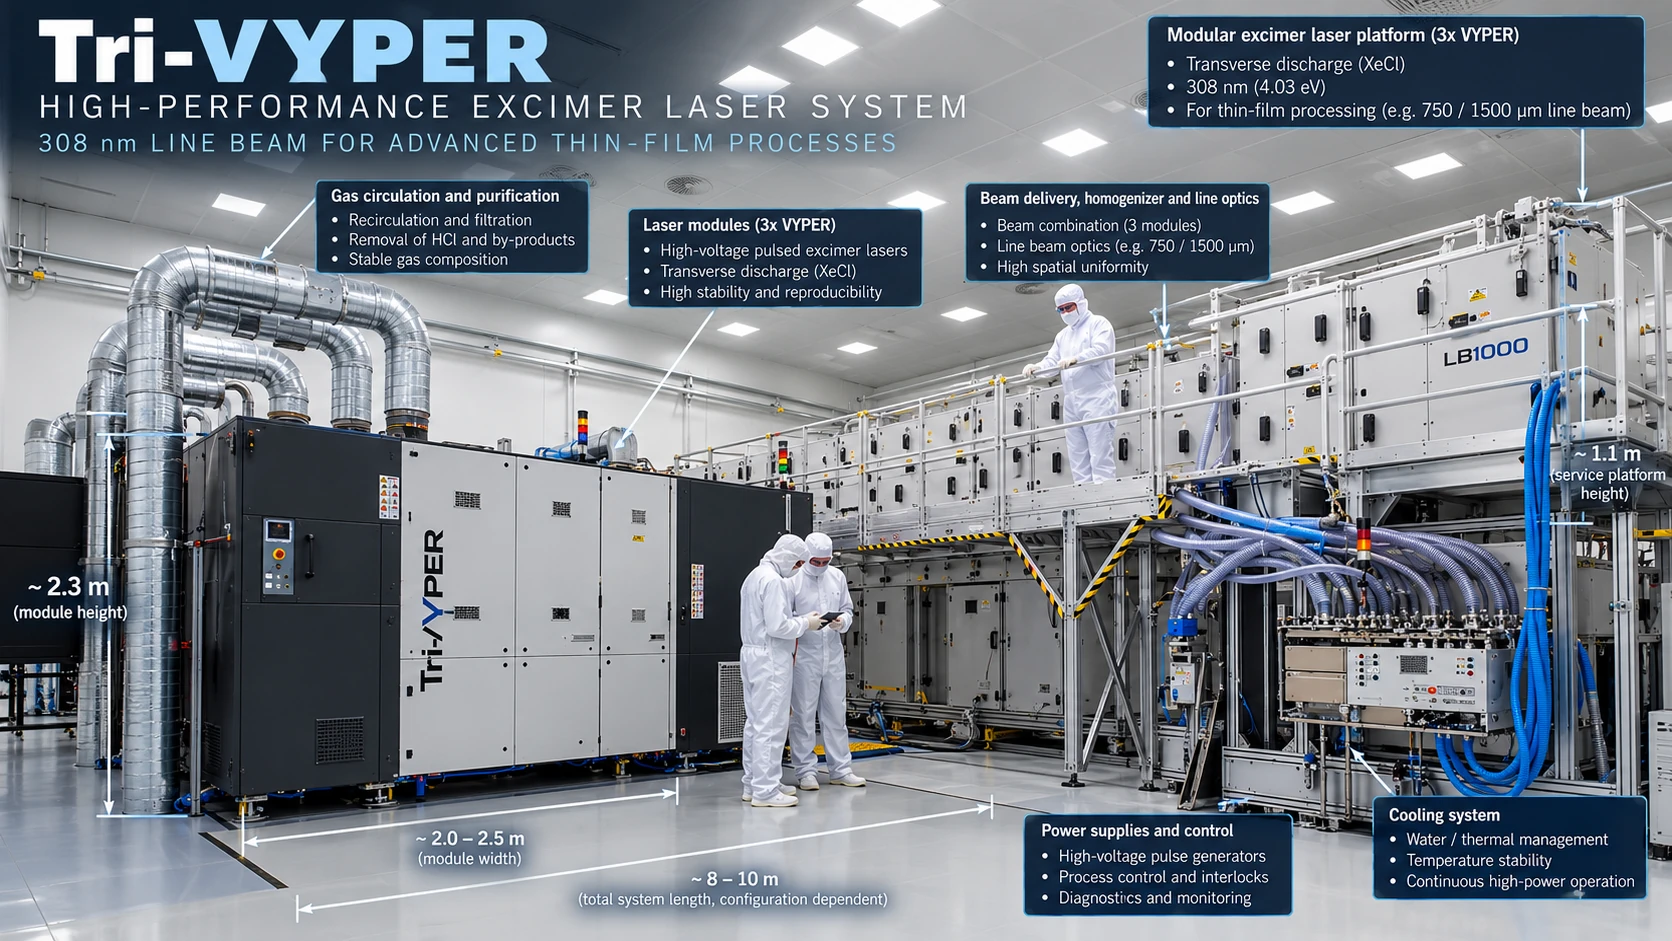
Large-area display manufacturing demands optical throughput and an extended line profile. Combining several laser sources increases the available energy budget, but it also multiplies the requirements on timing, energy balancing, thermal management, alignment and diagnostics.
Feff(x,y) = Σj Fj(x,y−jΔy),
The expression illustrates overlapping exposures during scanning; the exact coordinate convention and overlap weights depend on machine geometry. Industrial LineBeam widths and system names describe specific commercial implementations and must not be confused with universal material constants.
The illustrated Tri-VYPER-scale system and nearby human figure convey the industrial scale only. The depiction intentionally changes housings and auxiliary structures; it is not an exact reproduction of proprietary Coherent equipment.
7. ABSORPTION AND THE THERMAL TIME SCALE
The silicon film absorbs part of the incident UV energy. In a simplified one-dimensional optical model, the local intensity decays with depth z according to Beer–Lambert absorption.
I(z) = I0(1−R) exp(−αz),
q̇(z,t) = αI0(t)(1−R) exp(−αz).
Here α is an effective absorption coefficient and R the reflectance. Both can change with temperature, phase and film stack. The thermal evolution is described schematically by
ρcp∂T/∂t = ∇·(k∇T) + q̇ − ρLm∂fm/∂t,
where fm is the melt fraction and Lm the latent heat of fusion. The diffusion length over a characteristic time τ scales as
ℓth ~ √(Dτ), D = k/(ρcp).
A short pulse can therefore heat a thin silicon film intensely while limiting heat penetration into the glass on the pulse time scale. The glass is not assumed to remain perfectly cold: the subsequent cooling and repeated exposures still matter.
8. MELTING, SOLIDIFICATION AND POLYCRYSTALLINE SILICON
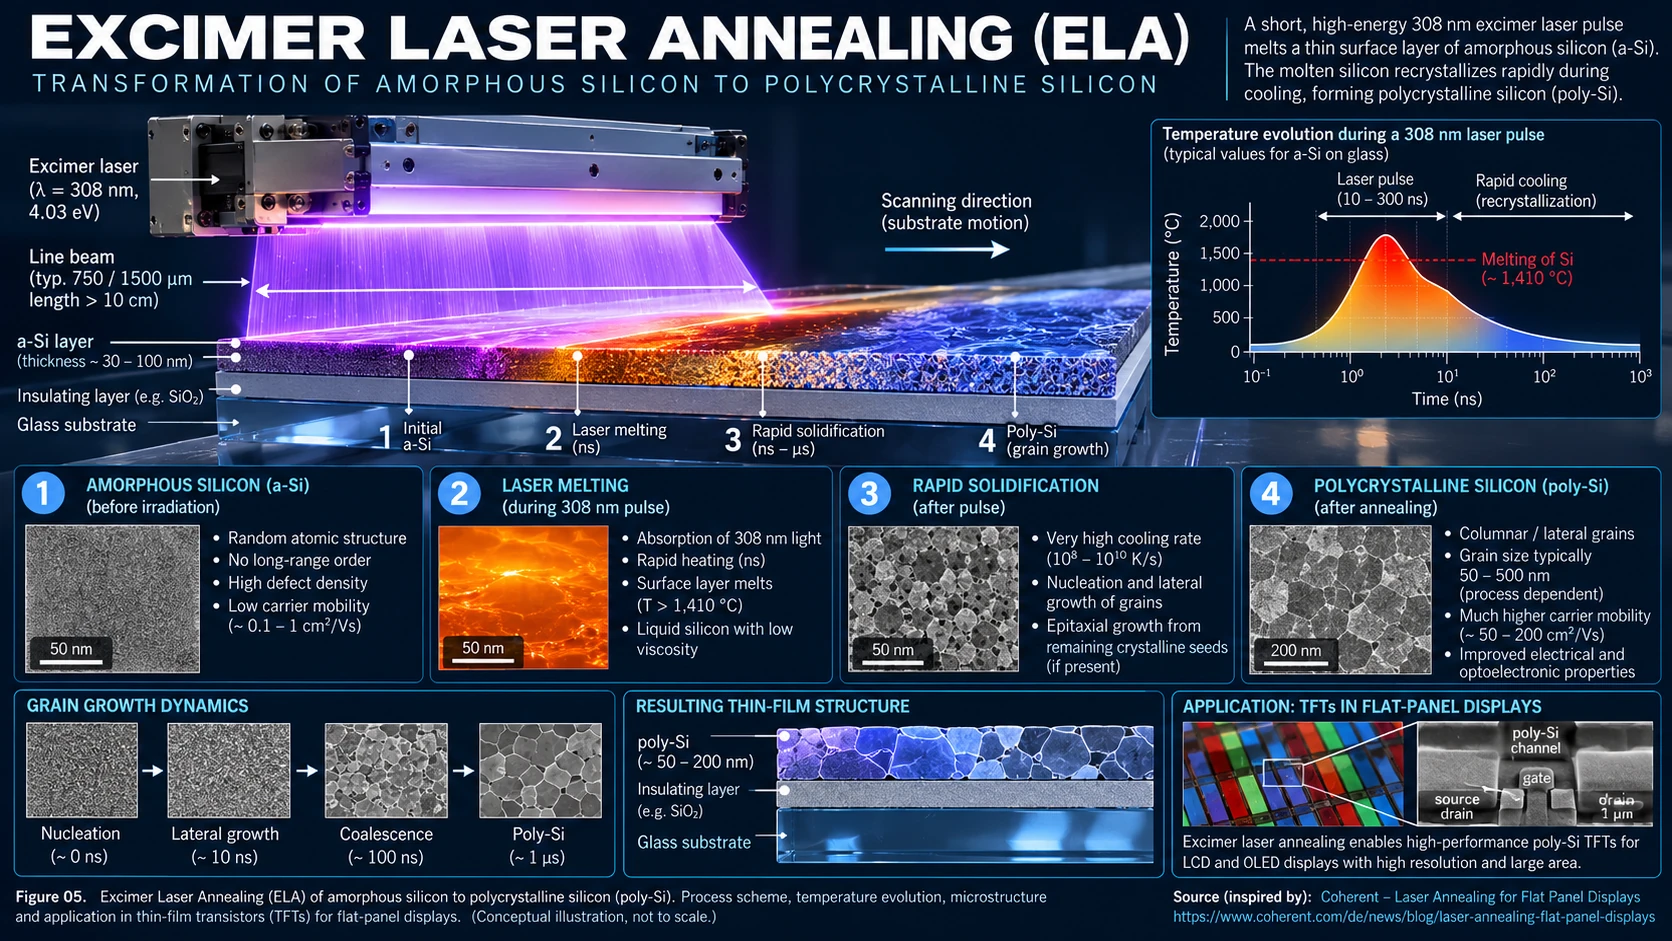
Initially deposited amorphous silicon (a-Si) lacks long-range crystalline order. With an appropriate energy density, the film melts locally and resolidifies as polycrystalline silicon (poly-Si), composed of crystalline grains separated by grain boundaries. This is not the production of a single perfect crystal.
The solidification outcome depends on film thickness, absorbed fluence, melt depth, interface conditions, thermal gradients and nucleation. Too little energy may leave insufficient transformation; too much can lead to undesirable morphology or damage. The useful processing window must be established experimentally for the actual stack.
Fabs ≈ (1−R)Finc[1−exp(−αd)],
where d is the silicon thickness. This is an optical-energy estimate, not a full melting threshold: heat capacity, latent heat, thermal transport and interface losses must also be considered.
9. WHY CRYSTALLIZATION HELPS A TFT
A thin-film transistor uses a gate field to control the conductivity of a semiconductor channel. Compared with amorphous silicon, appropriately processed polycrystalline silicon can provide higher carrier mobility, which can benefit pixel-driving circuits and high-density display backplanes. Grain boundaries and defects still influence device characteristics.
ID ≈ μCox(W/L)[(VGS−VT)VDS − VDS2/2],
This familiar gradual-channel MOSFET expression applies only under simplifying assumptions in the linear regime. Real poly-Si TFTs may show trap-limited transport, contact effects, leakage, hysteresis and nonideal threshold behavior. The equation serves to expose the role of carrier mobility μ, not to claim that a display TFT is an ideal bulk-silicon MOSFET.
tswitch ~ CnodeΔV/Idrive.
A higher available drive current can help charge a pixel or subpixel node within its addressing interval. The full display performance also depends on circuit topology, capacitances, compensation electronics and the electro-optical display technology.
10. FROM TFT BACKPLANE TO PIXEL MATRIX
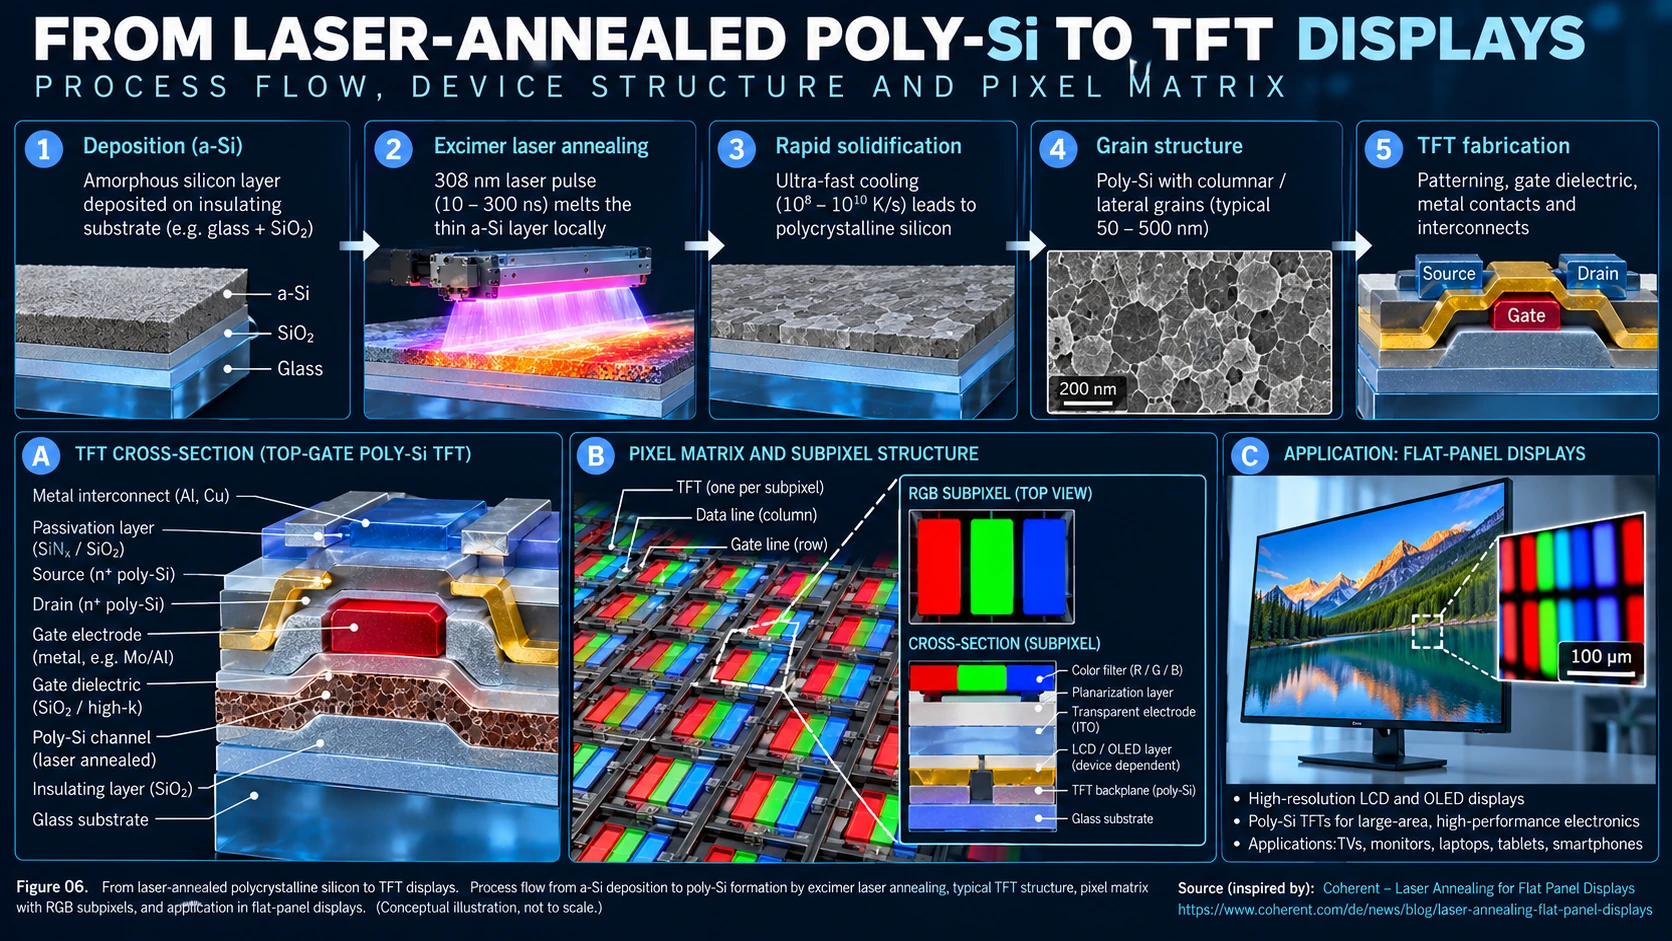
A display contains rows and columns of addressable picture elements. In an RGB layout, each color subpixel is driven through its associated electronic circuit. The TFT backplane does not create color by itself: it provides electrical switching or drive control for the display medium or light-emitting element.
The conceptual matrix diagram illustrates this relationship but is not a literal layer stack for every LCD, OLED or other display technology. The backplane and optical/emissive layers vary substantially among architectures.
11. WHY THE MACHINES ARE SO LARGE
The physics takes place in a film only a tiny fraction of a millimeter thick, but industrial processing must repeat it across very large substrates with controlled spatial uniformity, pulse energy, alignment and uptime. Laser heads, power electronics, gas handling, heat exchangers, beam delivery, homogenizers, metrology and mechanical stability occupy space because each subsystem protects the processing window.
That is the central engineering paradox: an enormous ultraviolet machine can exist to change the microstructure of a remarkably thin layer. The final result is not a visible laser mark but a functional semiconductor backplane.
12. FROM EXCIMER GAS TO THE DISPLAY IN YOUR HAND
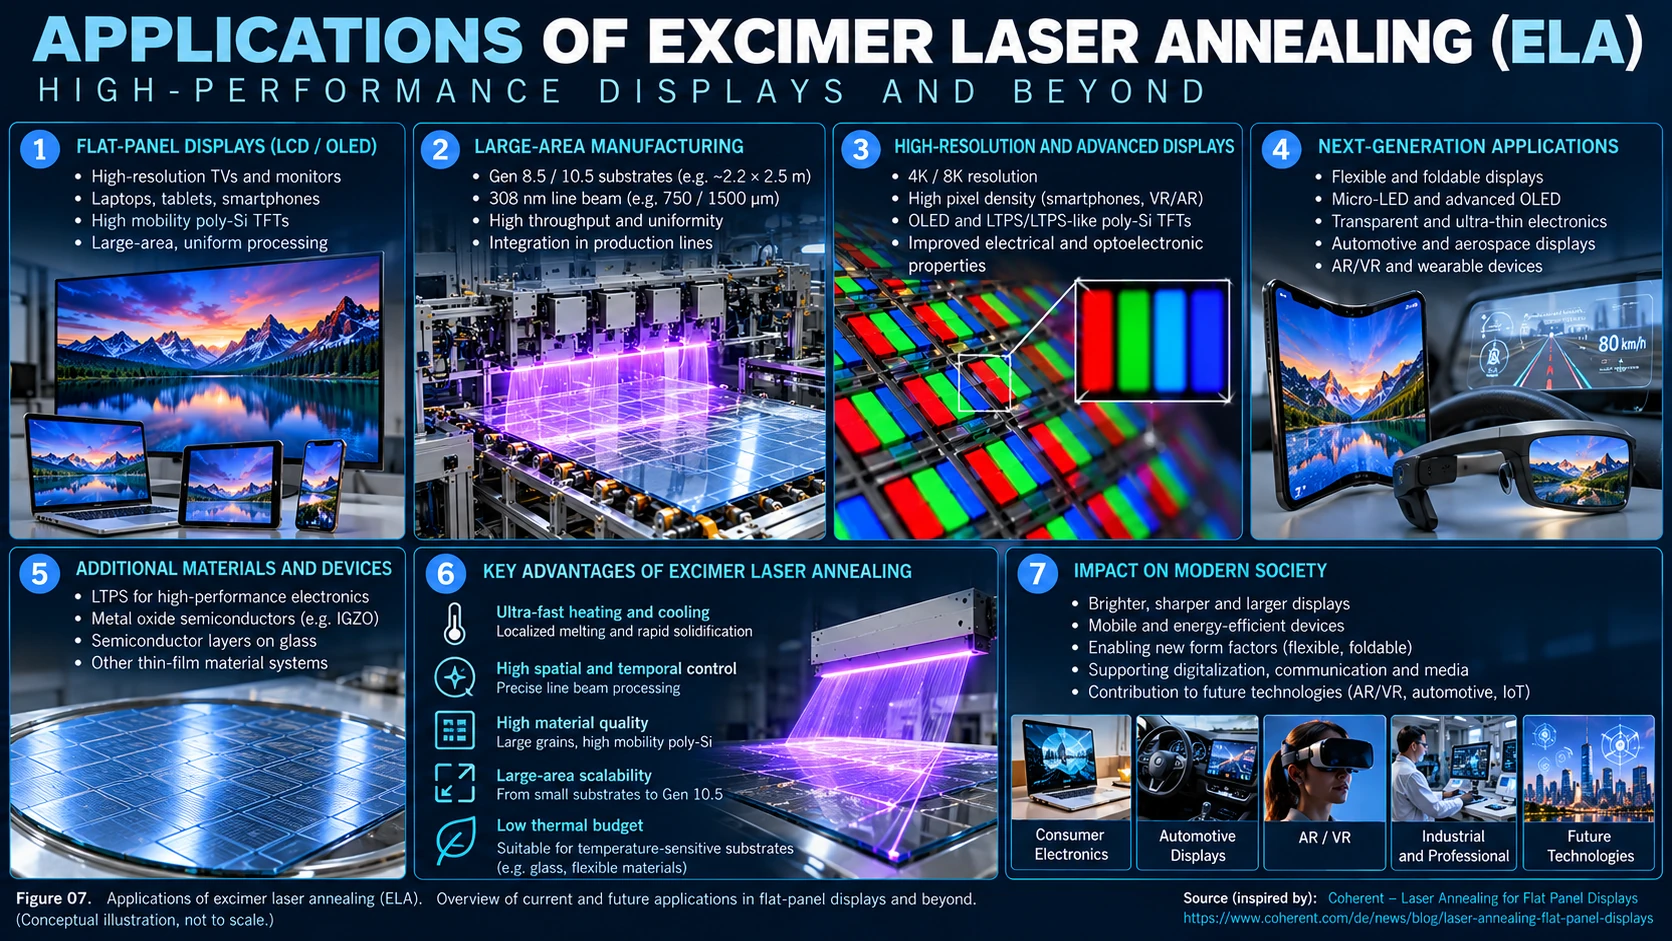
The causal chain is now complete: an electrical pulse drives a transient gas discharge; short-lived XeCl* states generate ultraviolet light; optical conditioning turns the radiation into a reproducible line; the line transforms a silicon film; polycrystalline silicon supports TFT circuitry; and that circuitry addresses the pixels of a display.
Not every modern display uses excimer-laser-crystallized poly-Si, and ELA is not the only possible semiconductor-processing route. But where it is used, the connection is remarkable: the quality of a screen can depend on events that began in a gas discharge lasting only nanoseconds.
From atoms to displays. Theoretical understanding is essential; industrial reproducibility is the real test.
REFERENCES AND FURTHER READING
[1] J. F. Ready, Industrial Applications of Lasers, 2nd ed., Academic Press (1997).
[2] D. B. Chrisey and G. K. Hubler (eds.), Pulsed Laser Deposition of Thin Films, Wiley (1994). Background on laser–material interaction; not an ELA process specification.
[3] S. M. Sze and K. K. Ng, Physics of Semiconductor Devices, 3rd ed., Wiley (2007). TFT and device-physics background.
Illustration and provenance note. Figures are AI-generated conceptual visualizations prepared for personal physics website. They are not experimental data, calibrated atomic structures, validated reaction schemes or exact reproductions of industrial machinery. Numerical examples are illustrative and must not be mistaken for a machine datasheet.
Visual reference: Coherent — Laser Annealing for Flat Panel Displays. Illustrations are independently generated conceptual artwork, not supplied or endorsed by Coherent.