Watching fluctuations relax.
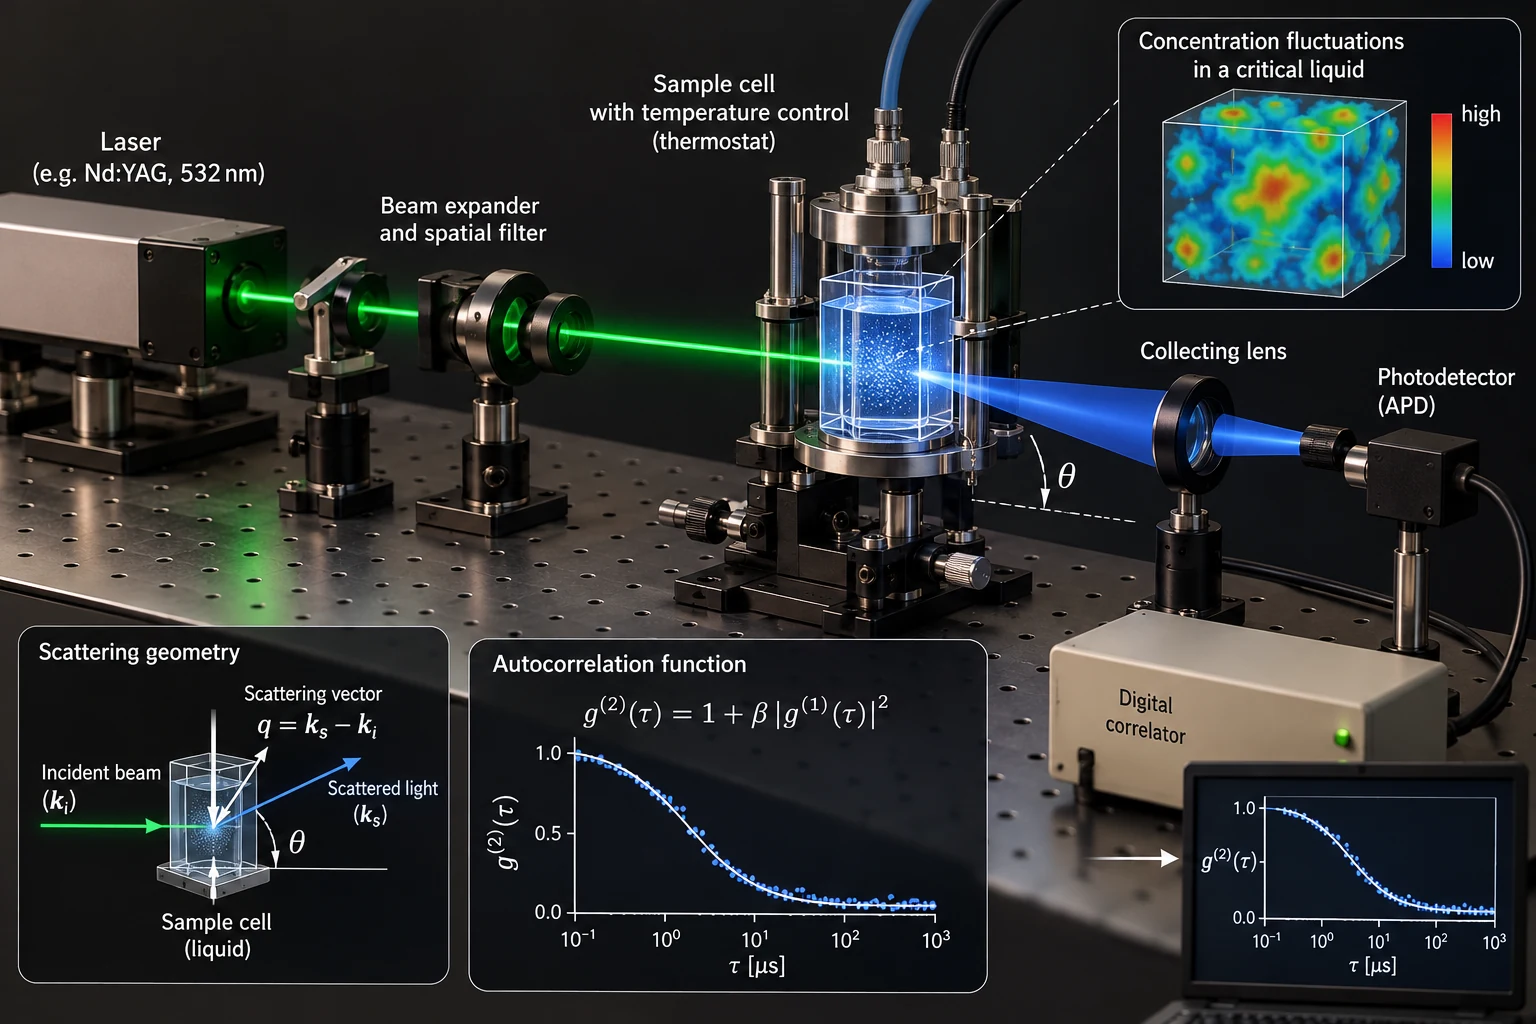
Dynamic light scattering provides access to the temporal evolution of microscopic fluctuations through the analysis of scattered light. In the work presented here, DLS was used not primarily for particle sizing, but to investigate concentration fluctuations in critical liquid mixtures.
The measured intensity fluctuations are transformed into an autocorrelation function. Its characteristic decay time provides access to the relaxation rate of the fluctuations and, through the scattering vector, to the mutual diffusion coefficient. Combined with shear-viscosity measurements, this allows the fluctuation correlation length to be determined.
The experiment therefore connects an optical signal with some of the central quantities of critical dynamics:

WHAT DLS MEASURES — IN THIS WORK
The detector records temporal fluctuations of the scattered light intensity. Rather than interpreting individual intensity values, the temporal structure of the signal is analysed by means of its autocorrelation function.
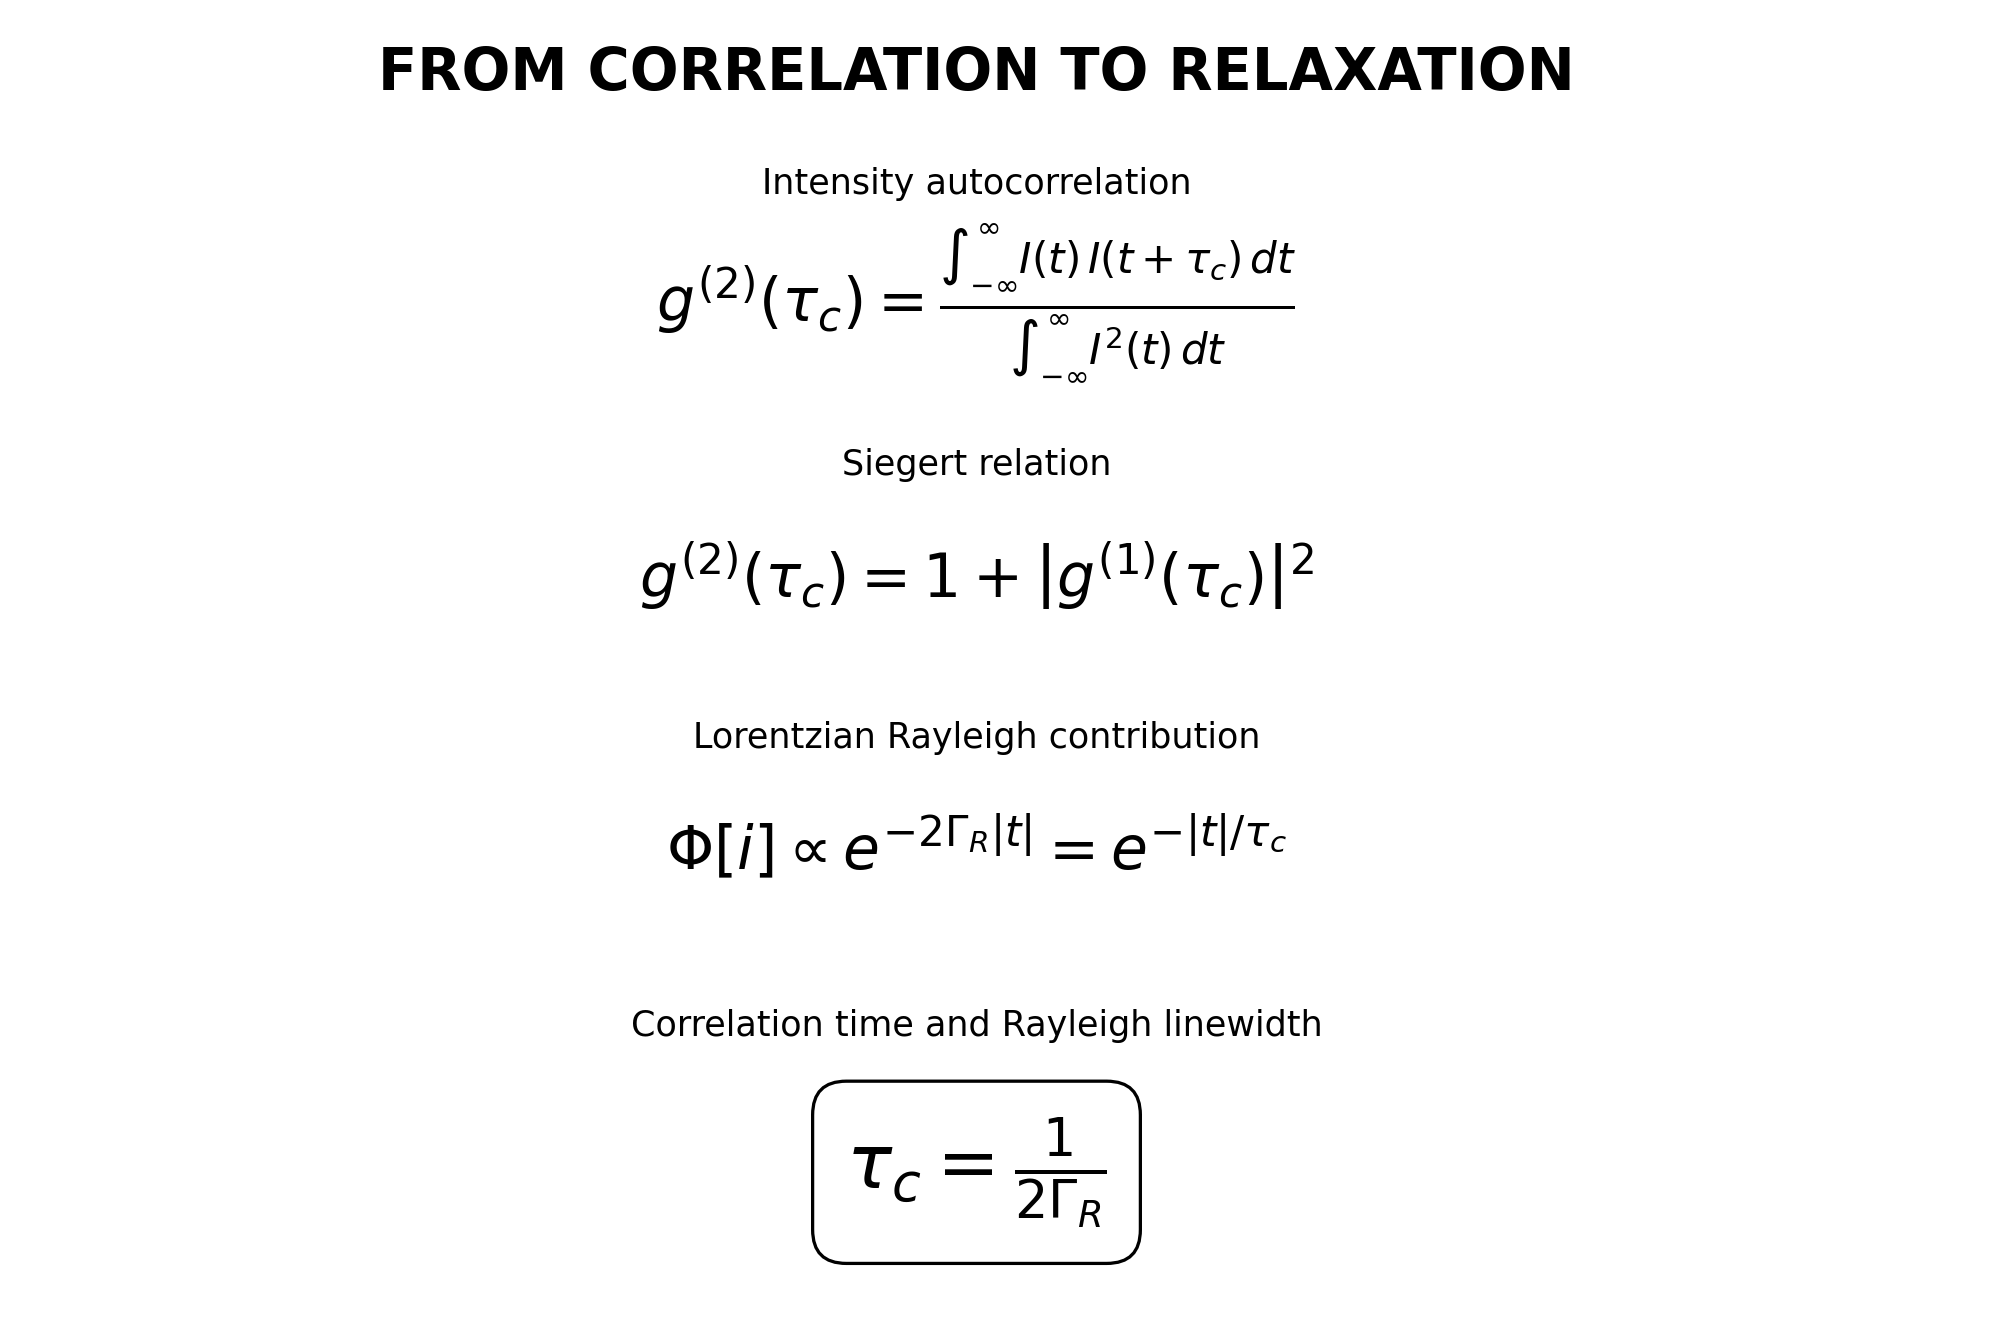
In the self-beating configuration used in this work, the experimentally accessible quantity is the normalized intensity autocorrelation function. Its decay contains the characteristic correlation time of the underlying fluctuations.
For a Lorentzian spectral contribution, the correlation time is directly related to the Rayleigh linewidth — and therefore to the characteristic relaxation rate of the fluctuations.
THE SPECTRUM OF SCATTERED LIGHT
In the hydrodynamic regime, the spectrum of the scattered light contains three characteristic contributions. A central Rayleigh line is accompanied by a Stokes–Brillouin and an Anti-Stokes–Brillouin component.
For the investigation of concentration fluctuations, the central Rayleigh contribution is of particular importance. Its spectral width contains information about the characteristic relaxation of the fluctuations and therefore provides the bridge from the frequency-domain description of the scattered light to the time-domain correlation analysis.
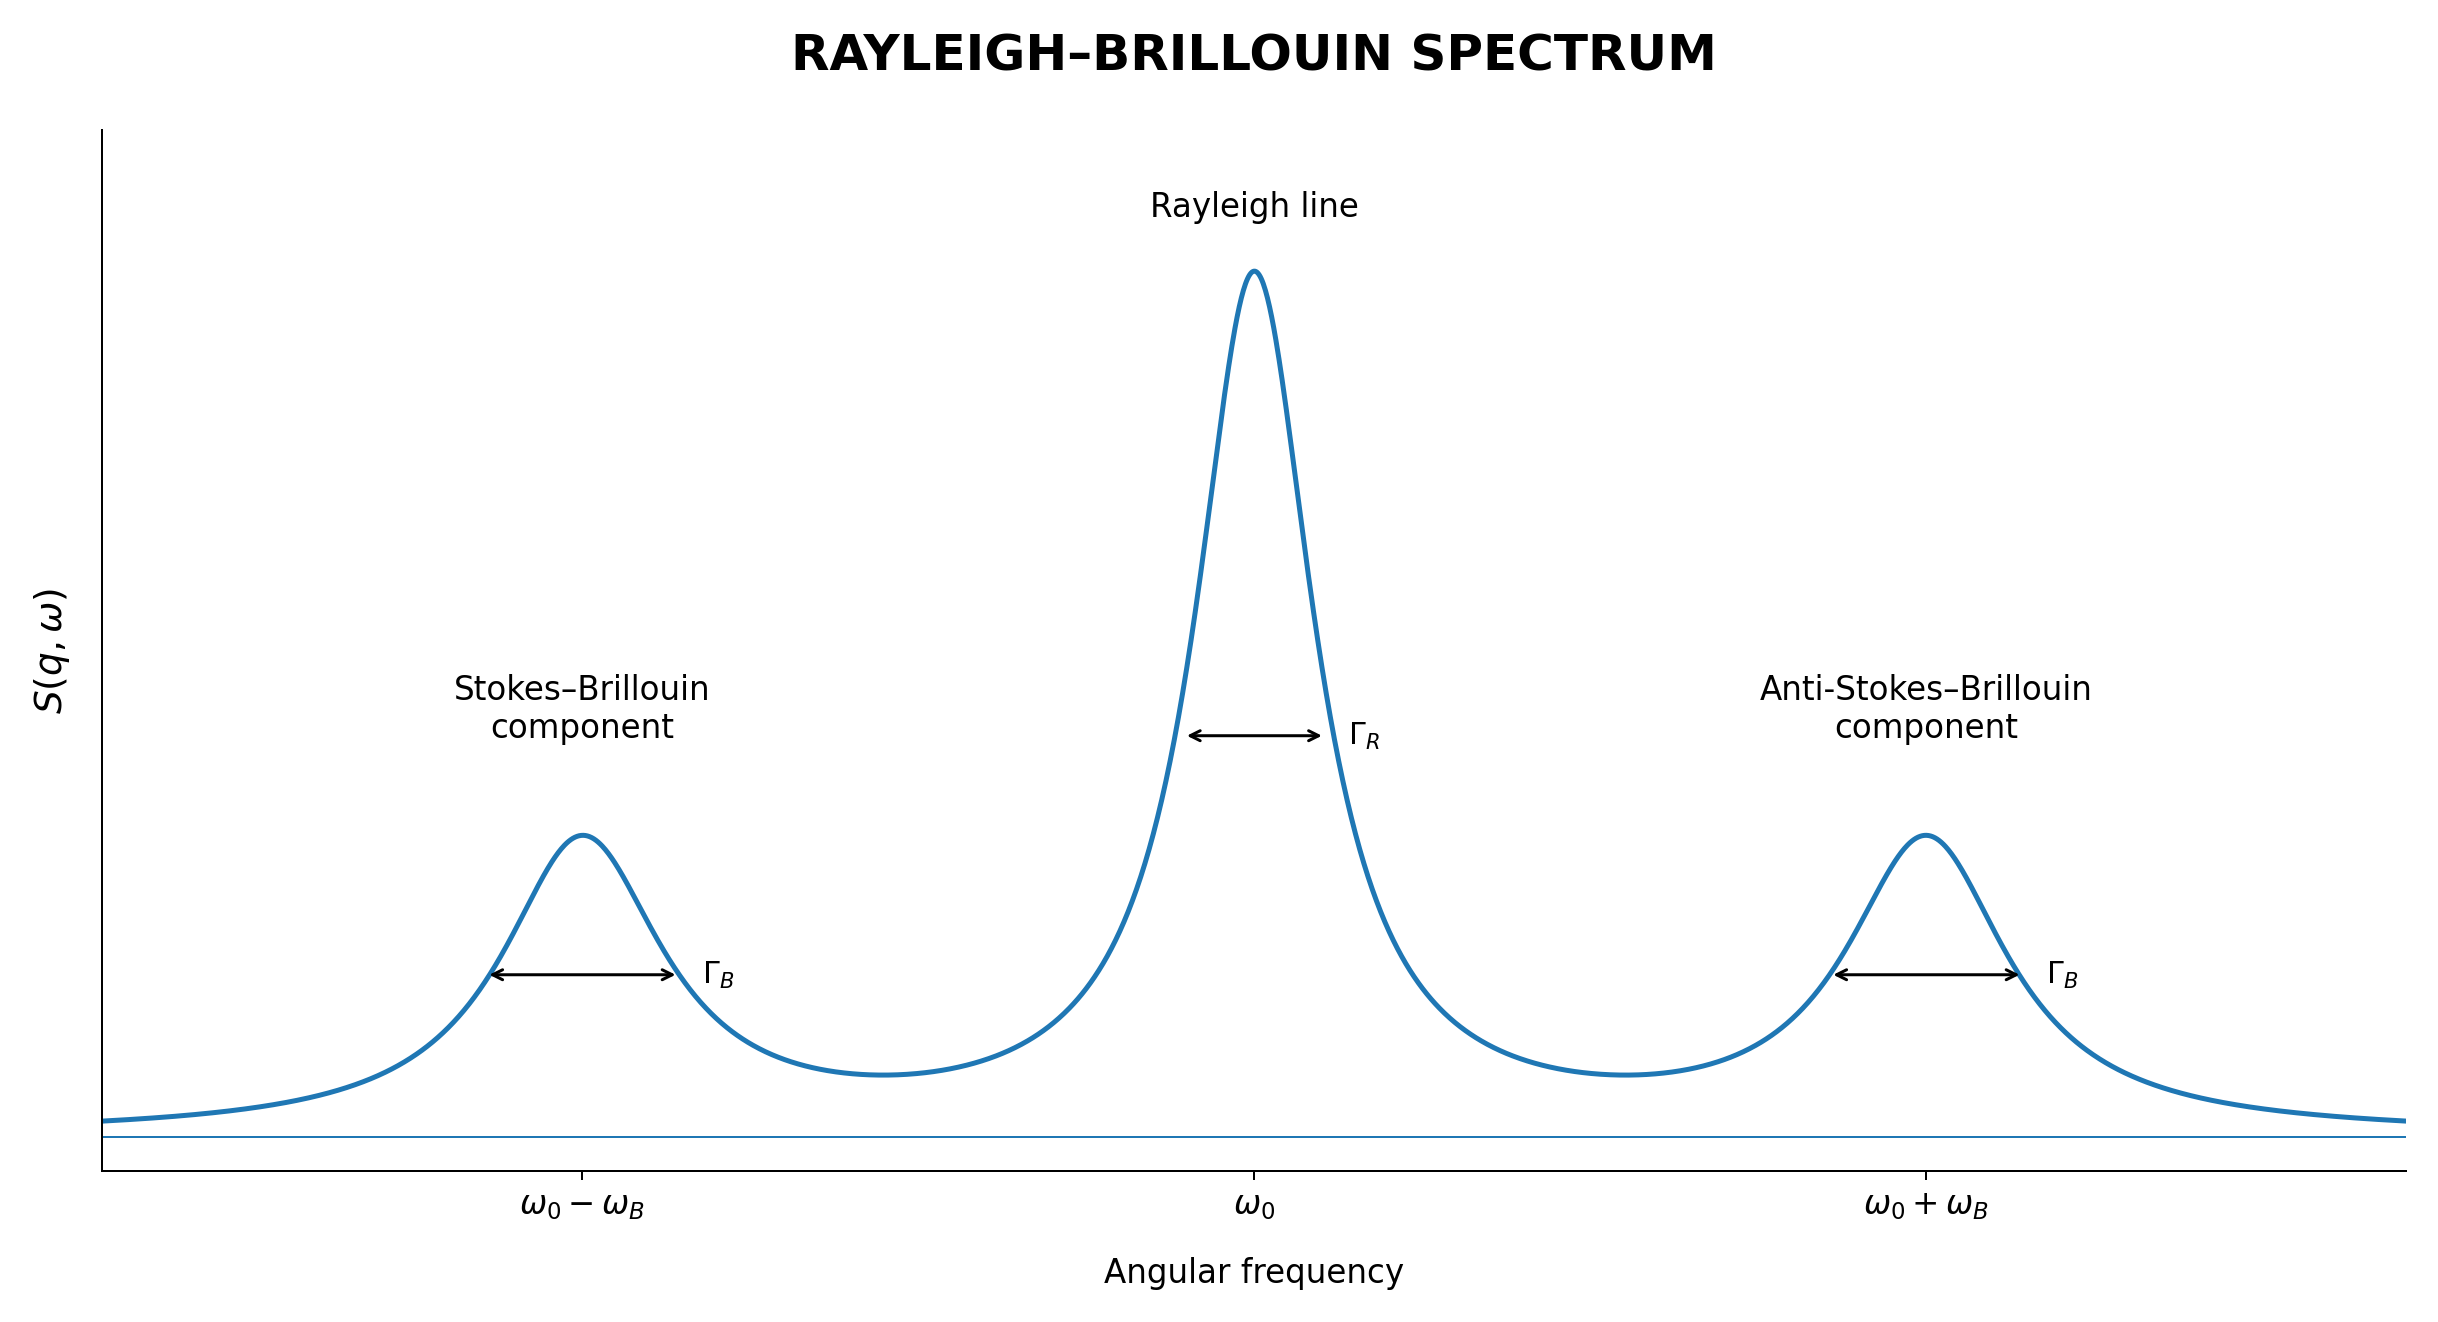
Experimentally, however, this extremely narrow spectral structure is not resolved directly by conventional optical spectroscopy. Instead, the temporal fluctuations of the detected light intensity are analysed by correlation spectroscopy.
FROM CORRELATION TO RELAXATION
The characteristic decay of the autocorrelation function provides direct access to the relaxation dynamics of the concentration fluctuations. For the self-beating configuration used here, the mathematical connection from the measured intensity correlation to the Rayleigh linewidth is summarized below.
FROM LIGHT TO PHYSICS
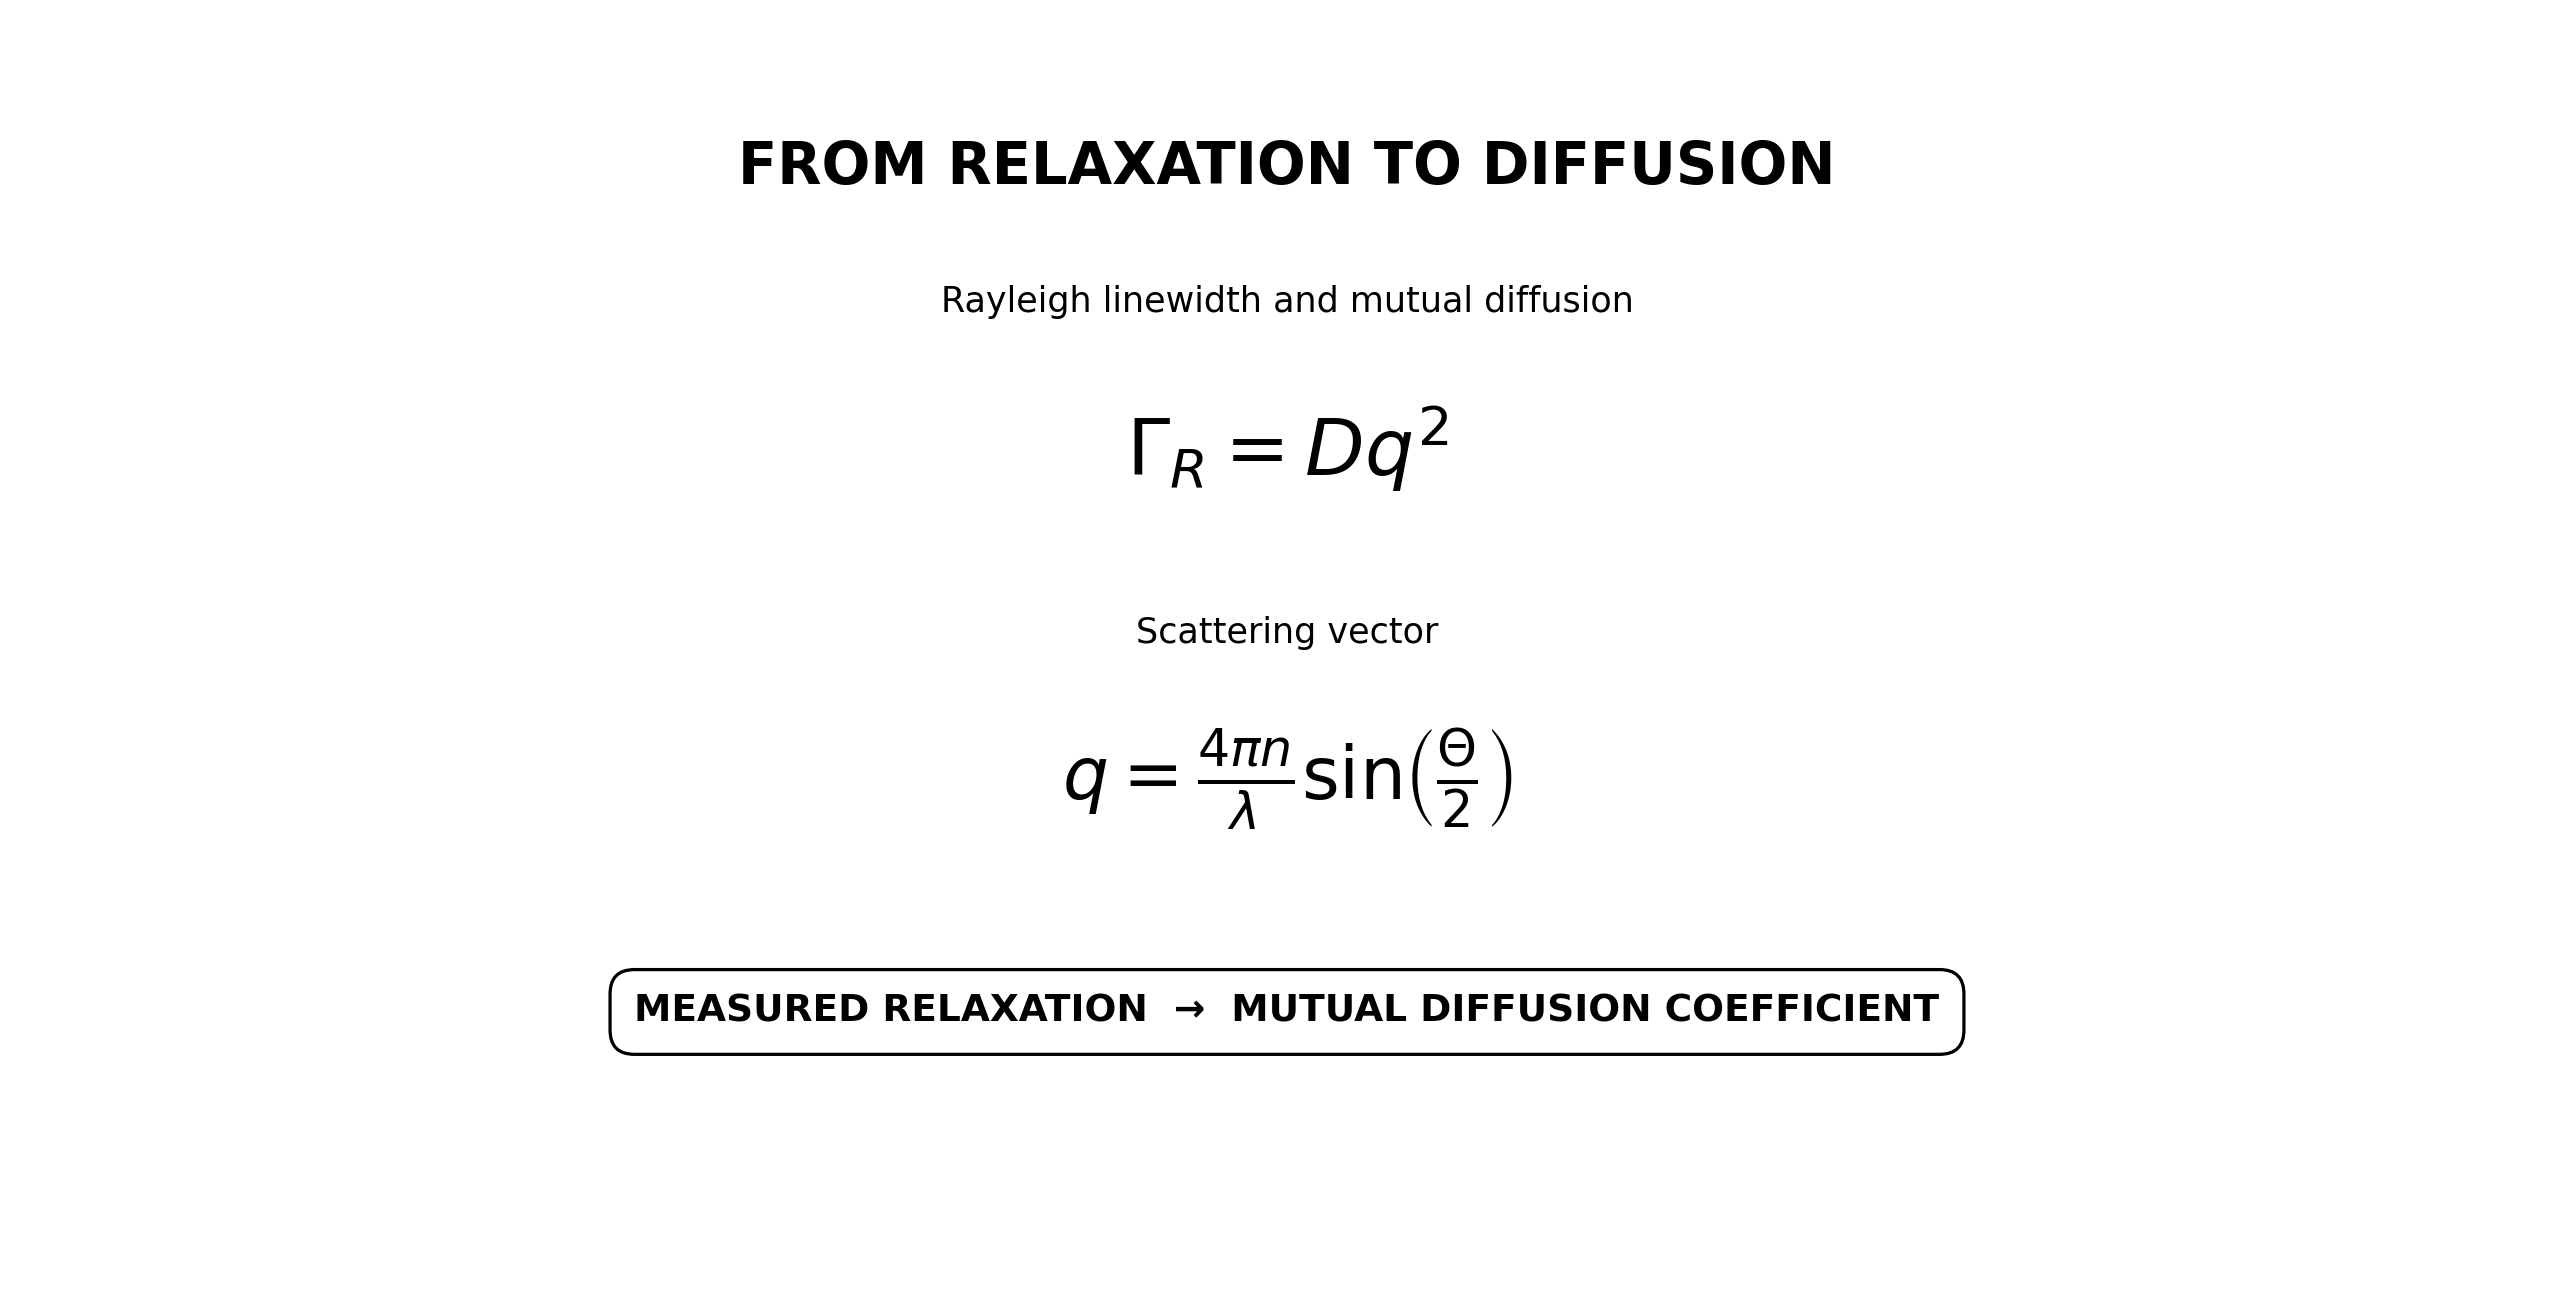
The relaxation rate is not merely a characteristic time scale of the measured optical signal. Through the scattering vector, it provides access to the mutual diffusion coefficient and therefore connects the observed light fluctuations directly with the dynamics of the liquid.
For diffusive concentration fluctuations, the Rayleigh linewidth is determined by the mutual diffusion coefficient and the square of the scattering vector. The scattering vector itself is fixed by the optical geometry, the refractive index and the wavelength of the incident light.
FROM DIFFUSION TO CORRELATION LENGTH
The mutual diffusion coefficient provides the next connection between the measured dynamics and the spatial structure of the fluctuations. The familiar Stokes–Einstein relation connects diffusion with thermal energy, viscosity and a characteristic length scale.
For critical concentration fluctuations, the characteristic length is no longer the radius of a diffusing particle. It is the fluctuation correlation length. Dynamic light scattering can therefore provide access not only to how rapidly the fluctuations relax, but also to their characteristic spatial extent.
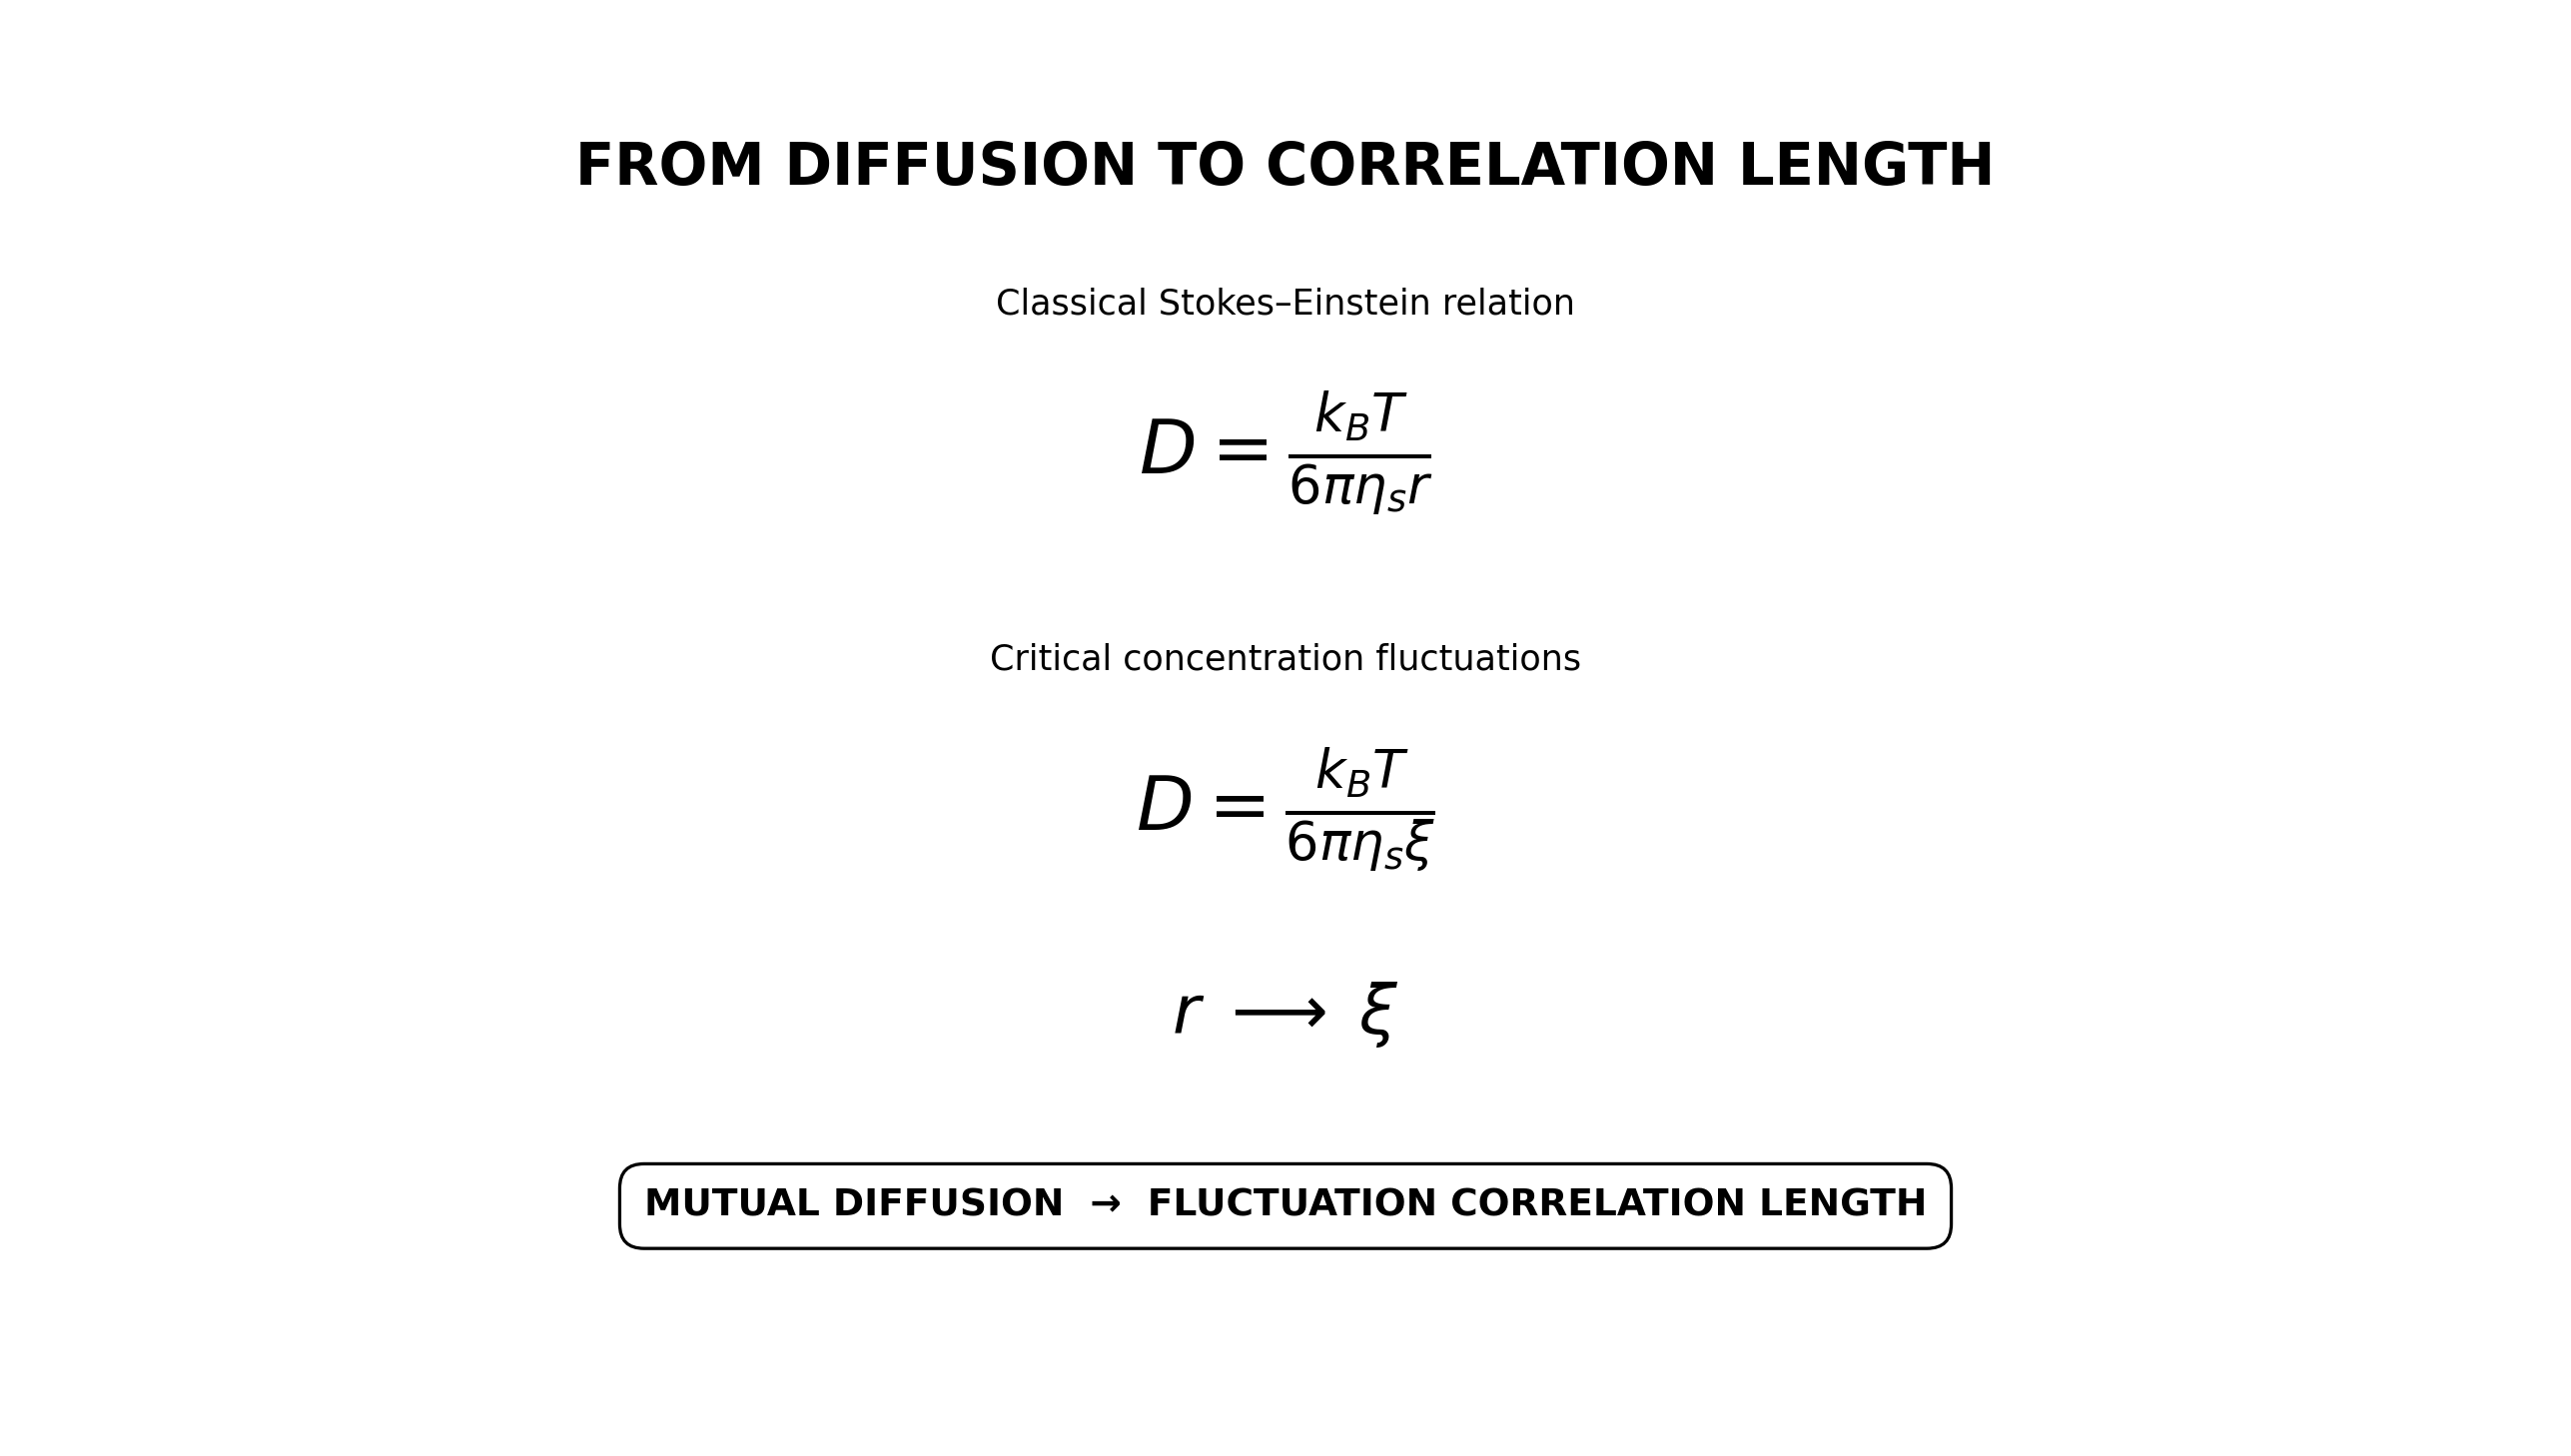
This connection turns the temporal information obtained from the scattered light into a spatial measure of the fluctuating liquid. Close to the critical point, that length scale becomes increasingly important for the dynamics of the system.
CRITICAL SLOWING DOWN
As the critical point is approached, the fluctuation correlation length increases. The fluctuations therefore extend over increasingly large regions of the liquid, while their relaxation becomes progressively slower.
This is the phenomenon of critical slowing down. The growing spatial scale of the fluctuations is accompanied by a decreasing characteristic relaxation rate. Dynamic light scattering therefore provides direct experimental access to one of the central signatures of critical dynamics.
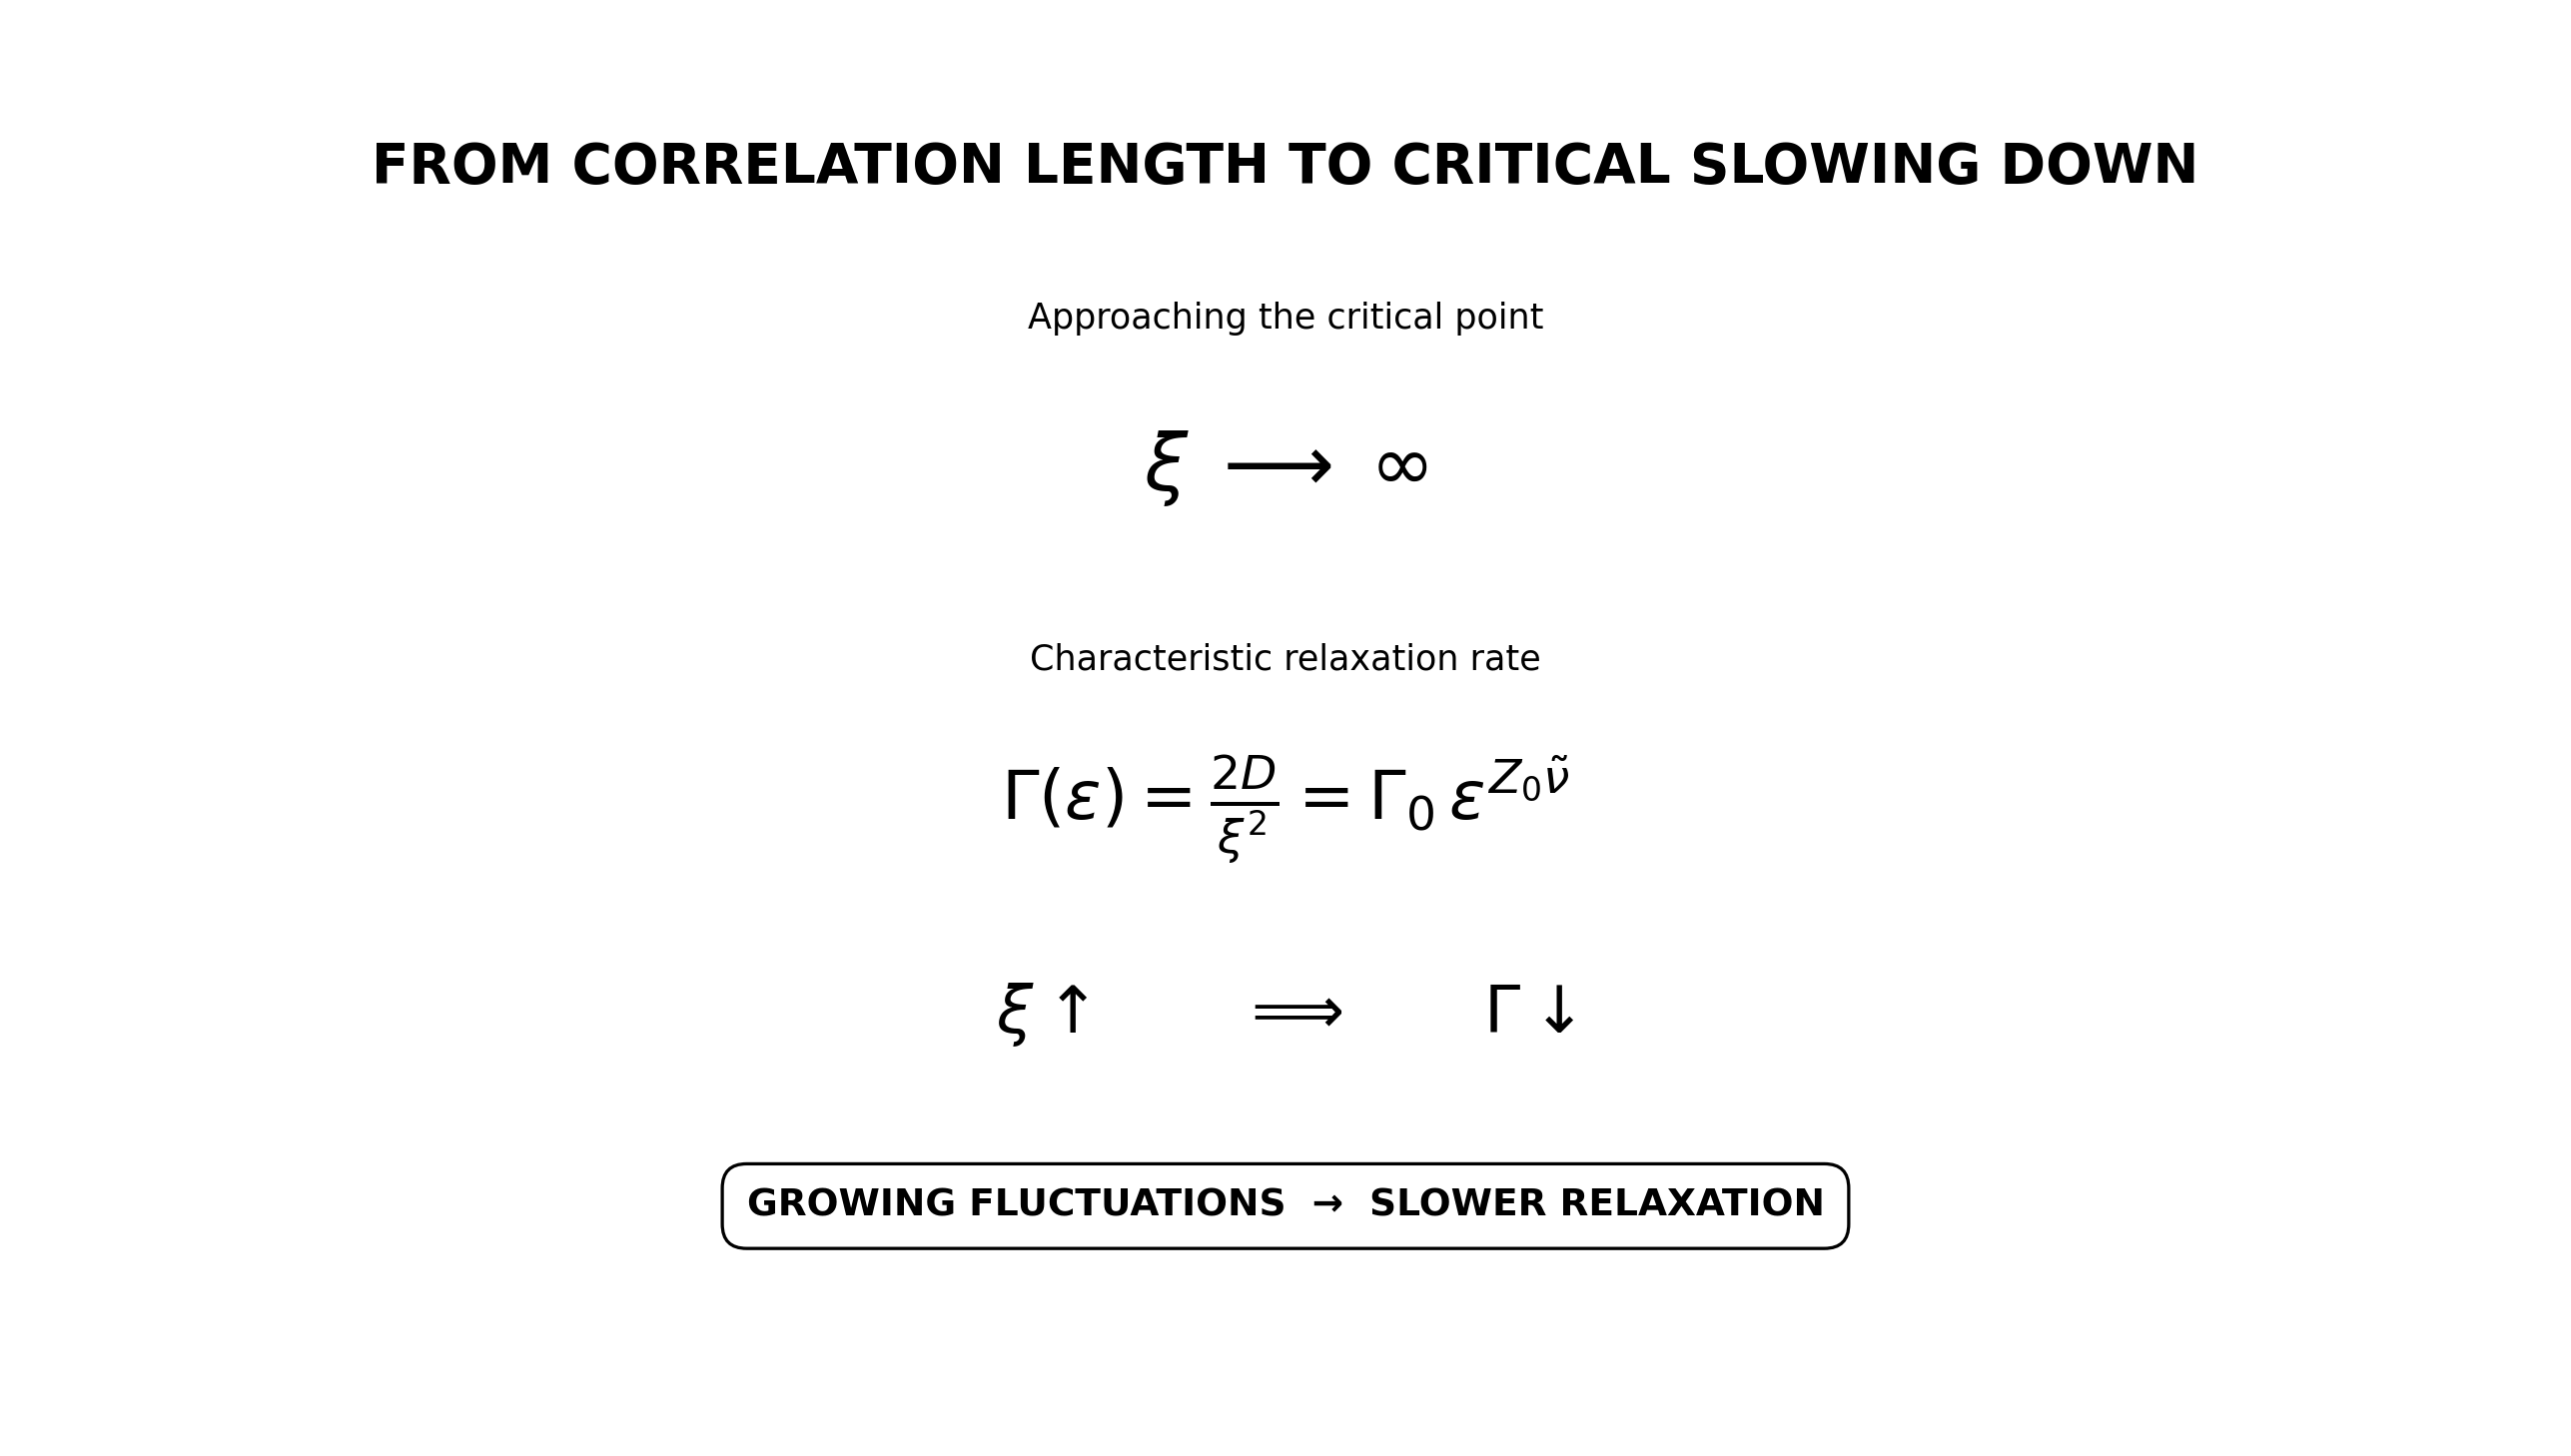
The connection between characteristic length and characteristic time leads naturally to the dynamic scaling description of the critical fluctuations.
DYNAMIC SCALING
Critical slowing down introduces a characteristic time scale in addition to the growing characteristic length scale of the fluctuations. Dynamic scaling combines these spatial and temporal properties within a common description of the critical dynamics.
The relaxation rate can be expressed as a homogeneous function of the scattering wave vector and the reciprocal fluctuation correlation length. This leads to a scaling form in which the dynamics are described by a dynamic scaling function.
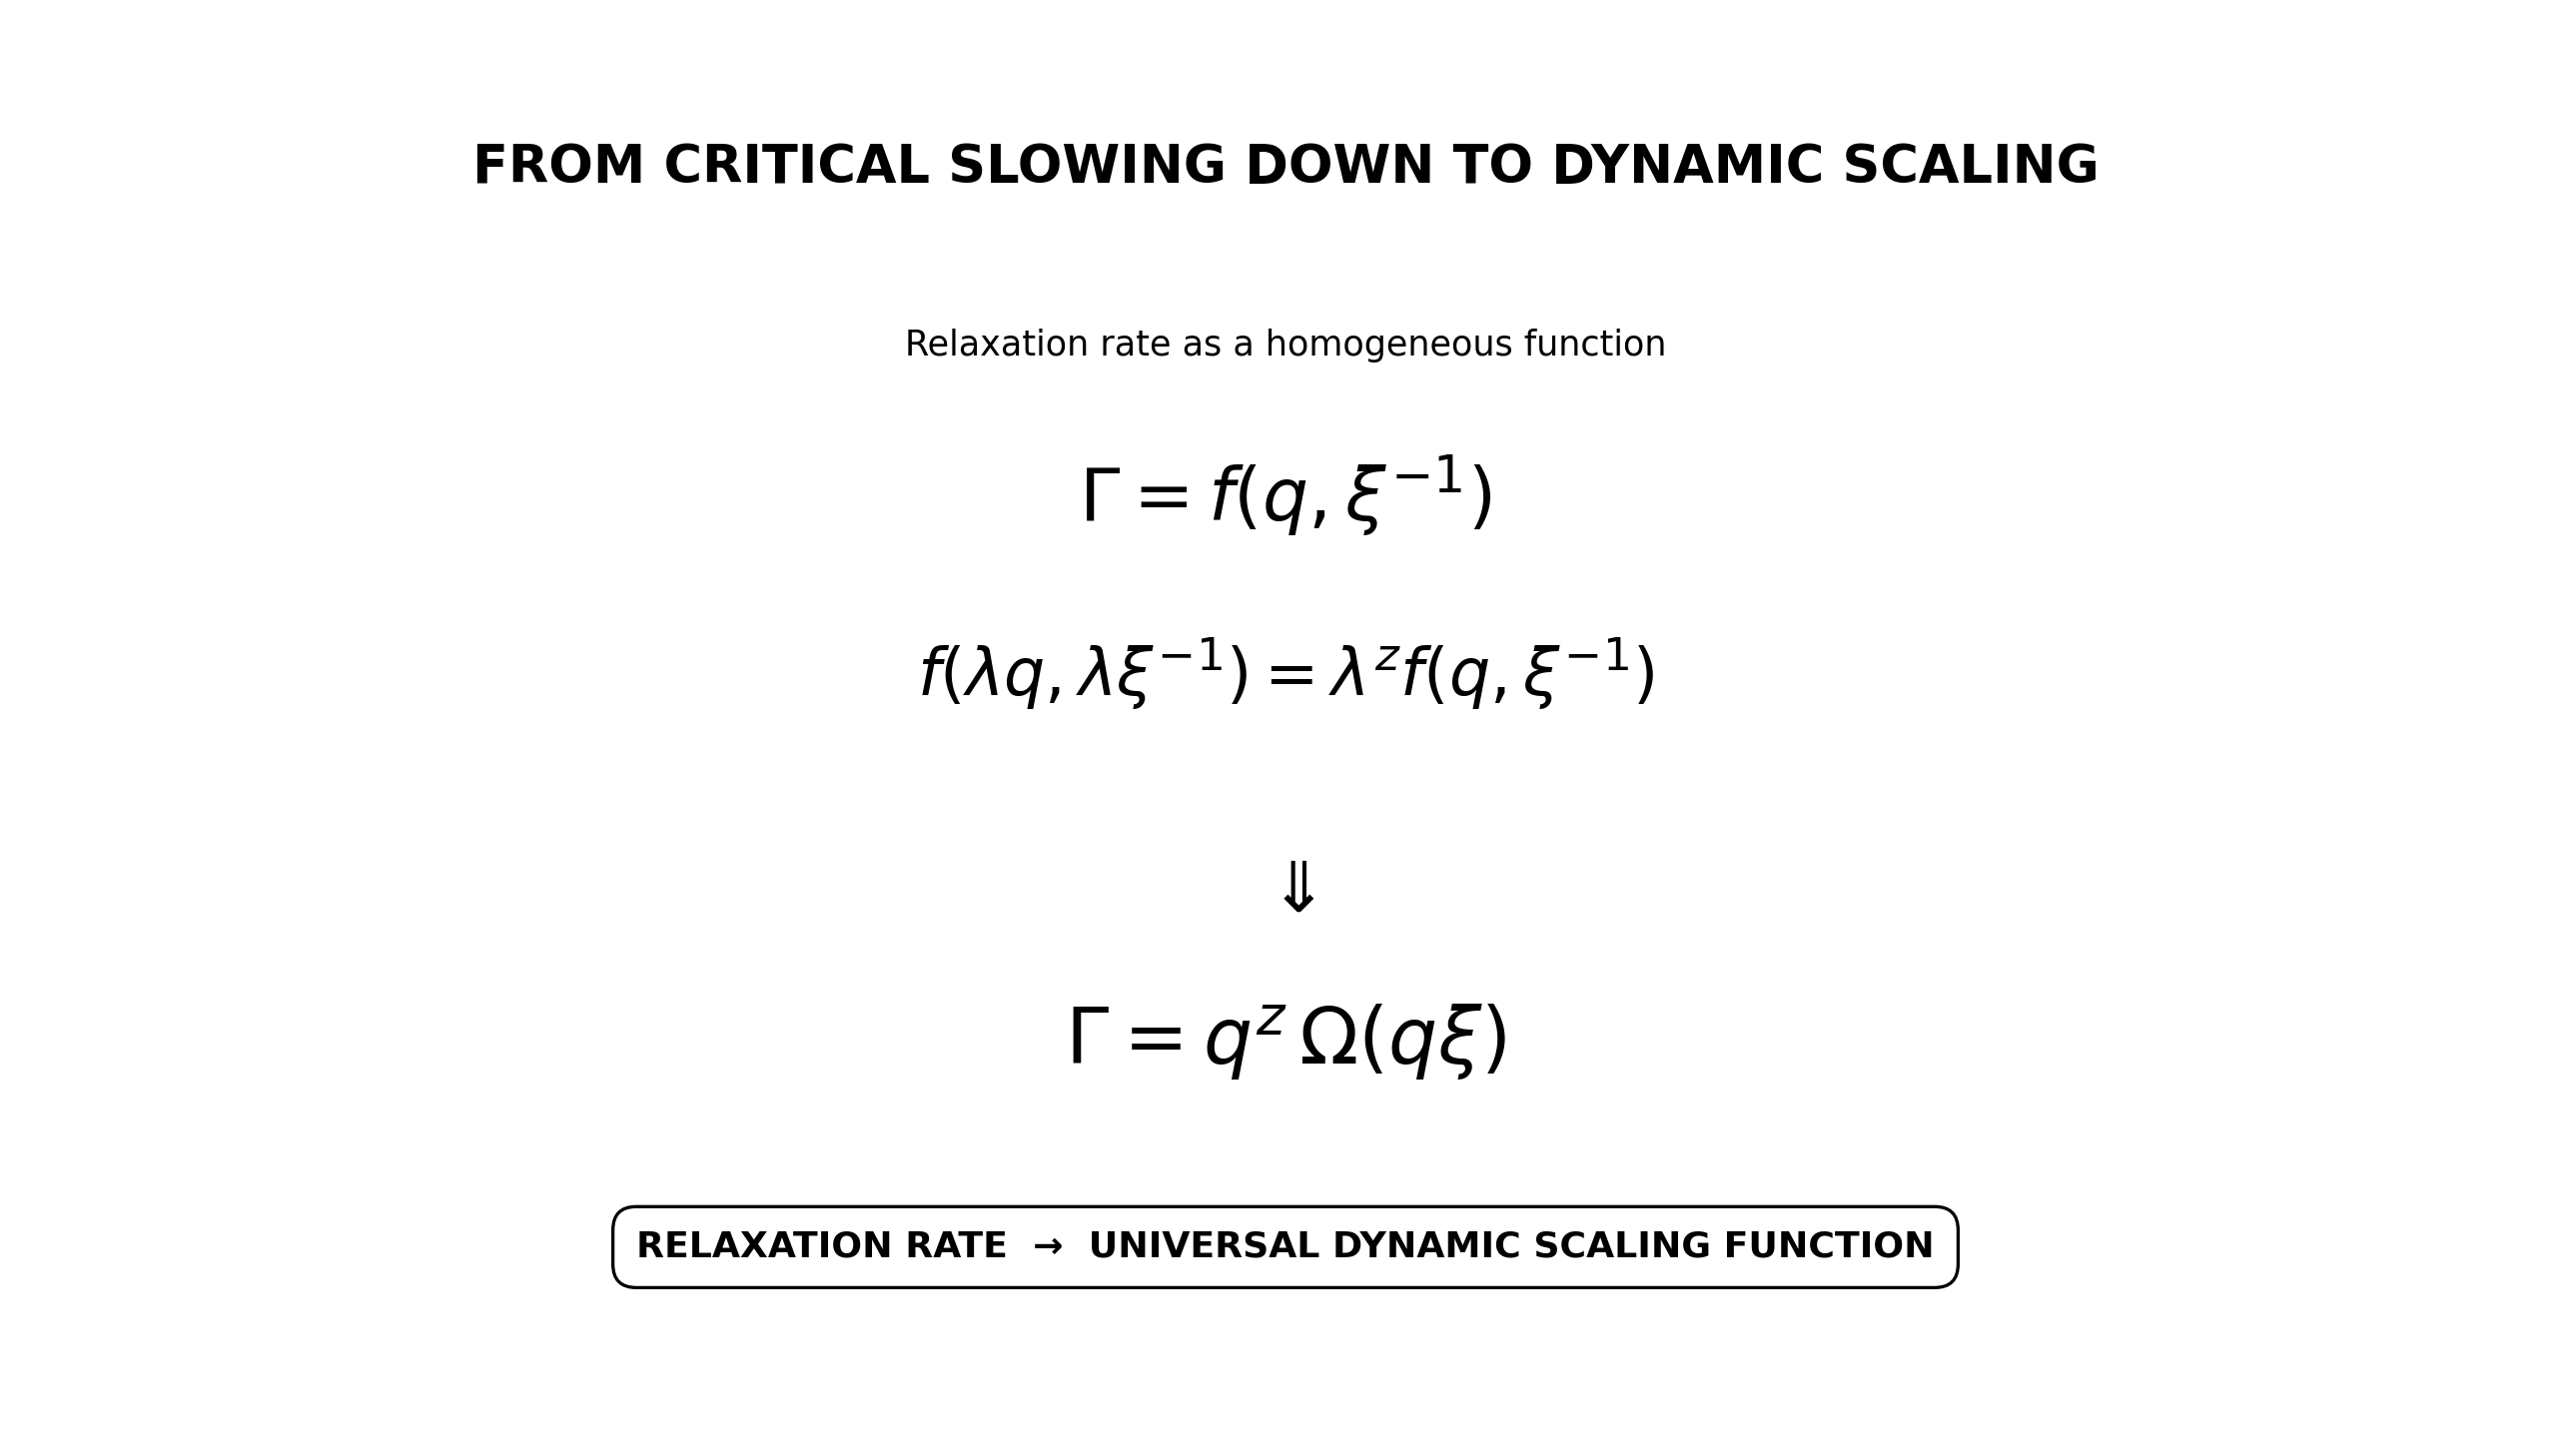
Dynamic light scattering thus connects an experimentally measured optical signal with the characteristic spatial and temporal scales of a critical liquid. This makes it possible to test the dynamic scaling description directly against experimental data.