Making a long acoustic path fit into a small cell.
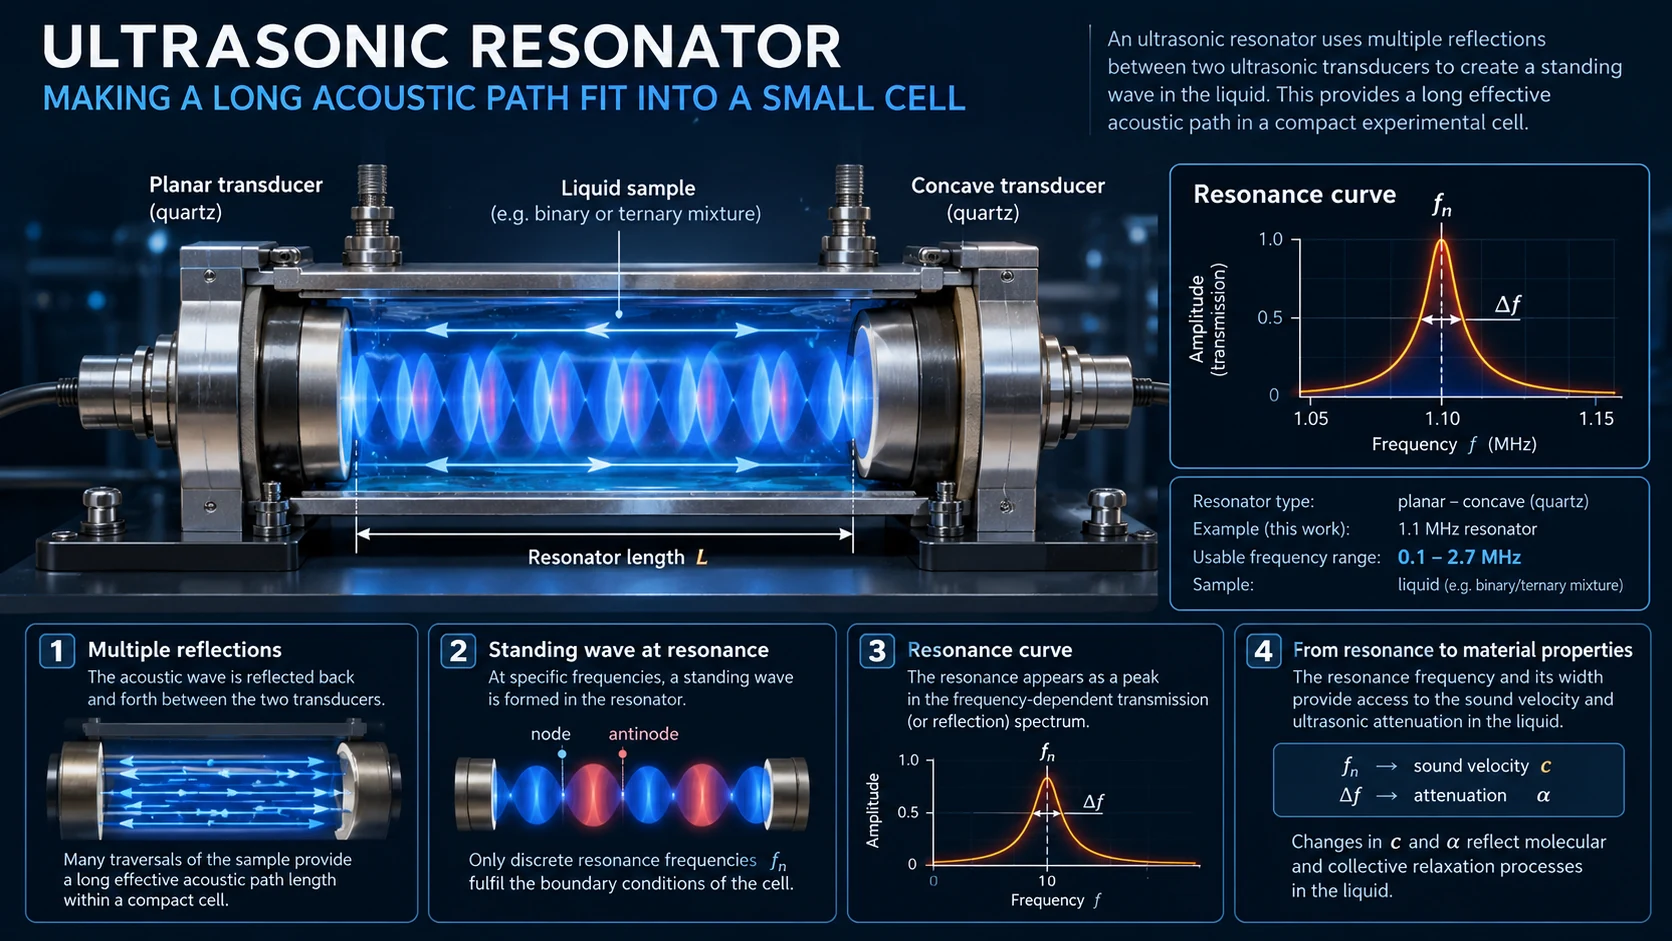
At low ultrasonic frequencies, direct transmission measurements encounter a fundamental experimental problem: the attenuation of a liquid may be so small that very long propagation distances would be required to measure it accurately. An ultrasonic resonator provides an elegant solution. Instead of increasing the physical length of the cell, the acoustic wave travels repeatedly through the same sample volume by reflection between two transducers.
At discrete frequencies determined by the acoustic properties and geometry of the system, the repeatedly reflected waves interfere constructively and form resonances. The liquid sample therefore becomes part of an acoustic resonator whose resonance frequencies and linewidths contain information about sound propagation and acoustic attenuation in the liquid.
FROM A LONG PATH TO A RESONATOR
Consider two ultrasonic transducers separated by a distance l. A wave emitted by one transducer propagates through the liquid, reaches the opposite transducer and is partially reflected. Repeated reflections produce many traversals of the sample and therefore greatly increase the effective acoustic path without requiring a physically long measurement cell.
In the idealized picture, the transducers are acoustically rigid and perfectly reflecting, the emitted wave is planar, diffraction can be neglected and all additional losses are small. The acoustic propagation is described by the complex propagation constant
γ = α + iβ
where α describes attenuation and β the phase propagation of the wave. Every round trip through the cell therefore contributes another attenuated and phase-shifted wave. The superposition of these repeated contributions produces the resonances.
THE TRANSFER FUNCTION
Experimentally, the resonator is not observed directly as an acoustic pressure field. The transmitting transducer is electrically excited and the receiving transducer converts the acoustic response back into an electrical signal. The relevant experimental quantity is therefore the complex transfer function
T(f) = Ue / Us ∼ Pe / Ps.
The transfer function contains the complete interference of the repeatedly reflected waves. Its magnitude exhibits a sequence of resonance peaks. In the ideal case, their frequencies are approximately
fn = n · c / (2l).
The spacing and position of these resonances therefore contain information about the sound velocity c, while their widths contain information about acoustic losses.
RESONANCE WIDTH, QUALITY AND ATTENUATION
A resonance is characterized not only by its frequency but also by its linewidth Δf. The corresponding quality factor is
Q = f / Δf.
For an ideal resonator, the attenuation coefficient is directly related to the resonance linewidth:
α = πΔf / c or αλ = π / Q.
This is the central experimental advantage of the method: a very small attenuation that would otherwise require a long propagation distance is transformed into a measurable property of a resonance line.
THE REAL RESONATOR
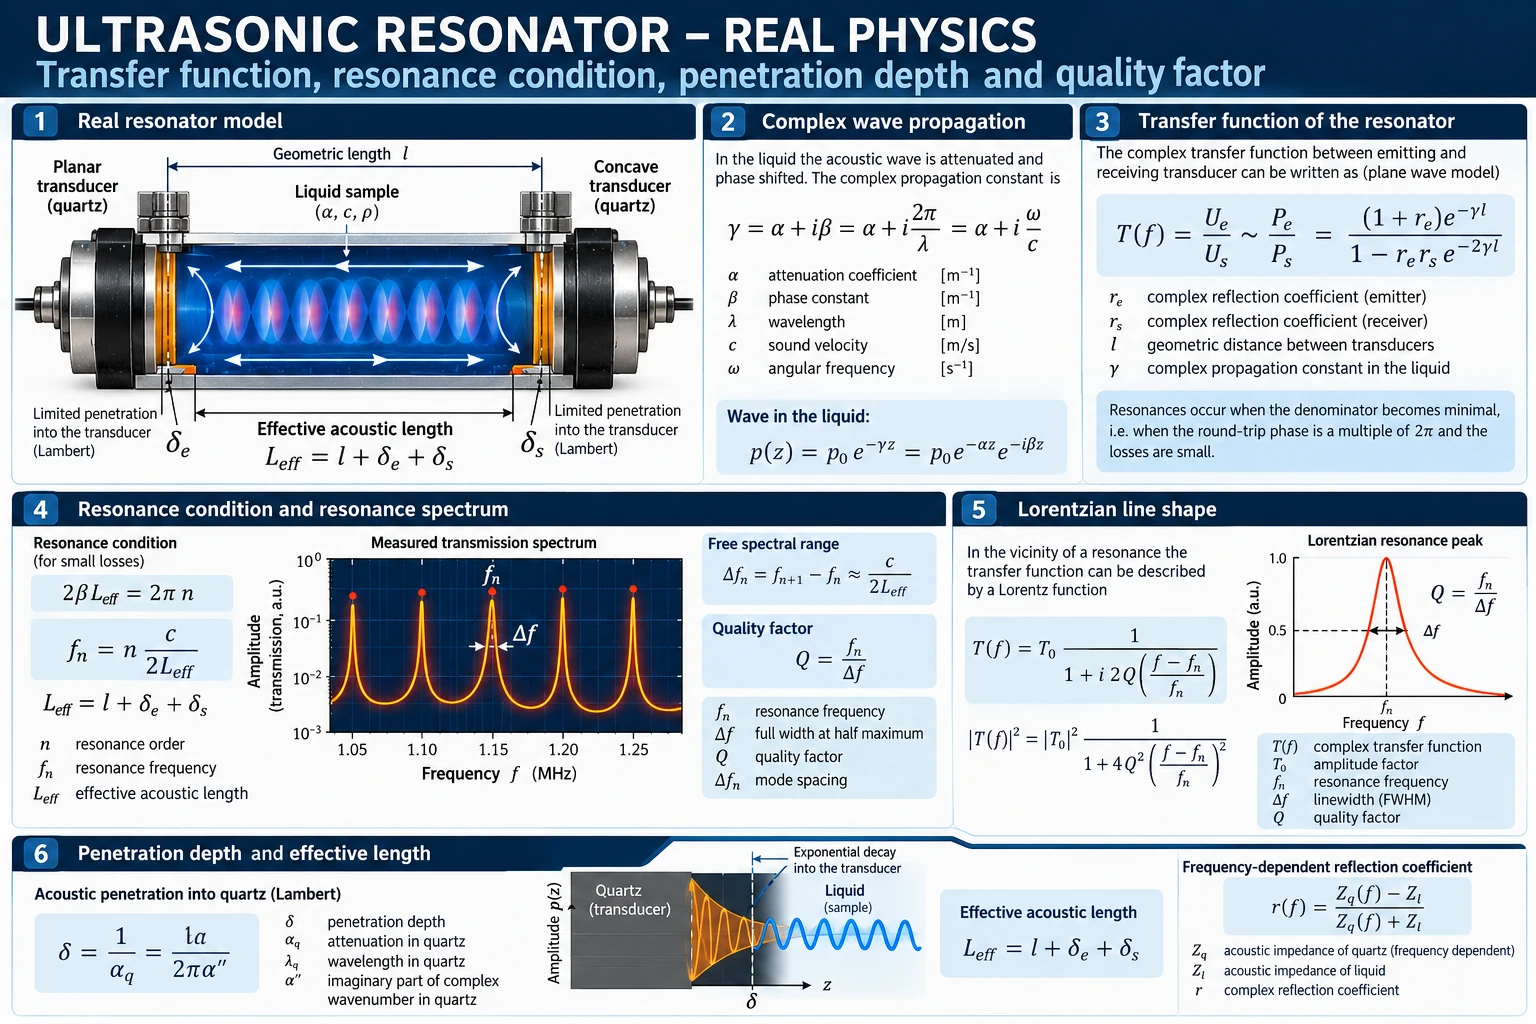
The simple relations above describe an ideal resonator. A real experimental cell is considerably more complicated. The quartz transducers are not perfectly acoustically rigid, their reflection coefficients are smaller than unity, their own mechanical resonances influence the acoustic field, and the finite geometry of the cell generates additional modes and losses.
The measured linewidth therefore does not represent the attenuation of the liquid alone. It contains both the desired sample contribution and contributions produced by the apparatus itself. These contributions can be summarized as apparatus losses.
Using the quality factor, their separation can be written as
1 / Qideal = 1 / Qmeas − 1 / Qapparatus.
Equivalently, the experimentally important attenuation quantity becomes
(αλ)ideal = (αλ)meas − (αλ)apparatus.
The important lesson is simple: what is measured is not automatically what the liquid does. The resonator itself leaves a fingerprint in every measured resonance.
THE TRANSDUCERS BECOME PART OF THE ACOUSTIC PATH
One of the most important deviations from the ideal model originates directly at the quartz transducers. Because their acoustic reflection coefficient is smaller than unity, the sound wave does not simply terminate at the geometrical liquid–quartz boundary. It penetrates acoustically into the transducers.
Consequently, the geometrical distance between the transducers is not identical to the effective acoustic propagation length. Moreover, this correction is frequency-dependent because the acoustic impedance of the quartz transducers changes with frequency. For water, a reflection factor of approximately r ≈ 0.8 is given as a representative value in the experimental treatment.
The correction is therefore not introduced as a single constant geometrical offset. Instead, the frequency-dependent transducer coupling is obtained from the spacing of neighbouring cell resonances and from the acoustic properties of the liquid and quartz transducers. This correction accompanied the actual measurement procedure and is essential for converting the observed resonance spectrum into physical properties of the liquid.
MAIN MODES, SIDE MODES AND GEOMETRY
Even after correcting for the transducers, a cylindrical resonator is not a one-dimensional system. Its geometry produces radial modes in addition to the desired longitudinal main modes. These side modes may occur close to a main resonance and distort its line shape.
This becomes particularly important because attenuation is extracted from the resonance width. A broadened or asymmetric peak cannot automatically be interpreted as increased absorption by the liquid: part of the apparent broadening may originate from overlapping acoustic modes.
The position of these side modes depends strongly on resonator geometry. For a plan-plan resonator one obtains a characteristic radial-mode spectrum, while even a slight curvature of one transducer changes the mode separation. For a plan-concave resonator the curvature radius therefore becomes an explicit parameter of the acoustic mode structure.
Geometry is consequently not merely a mechanical construction detail. It is part of the measurement physics.
DIFFRACTION, RADIATION AND ELECTRICAL CROSS-TALK
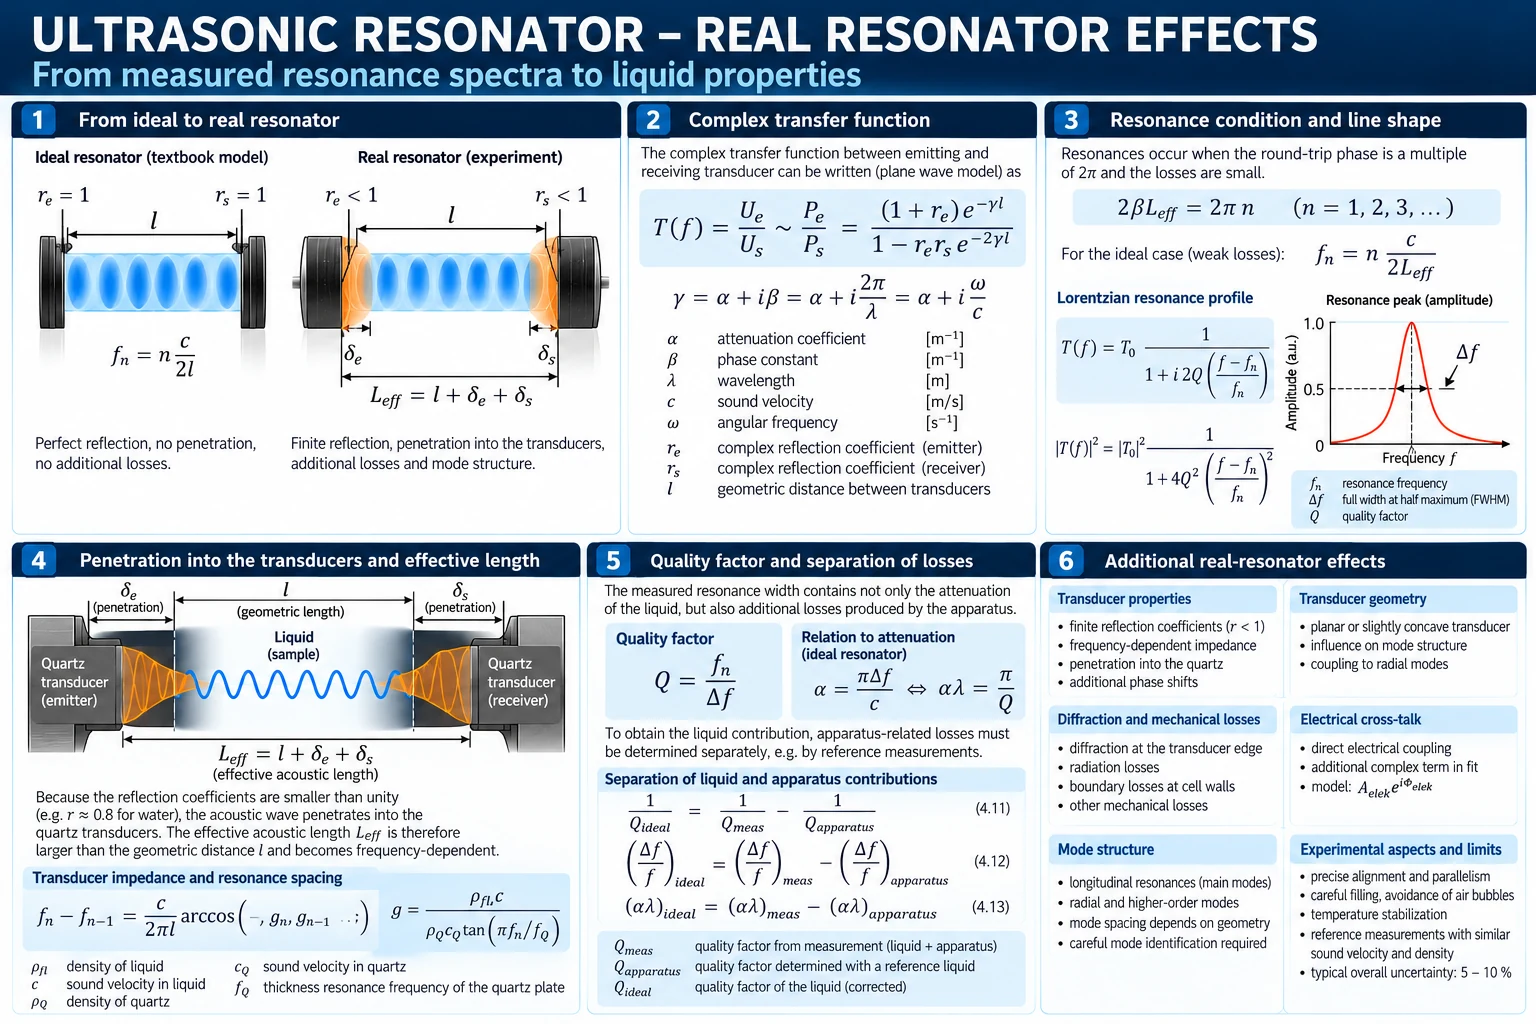
Additional mechanical losses arise from diffraction at the finite cell geometry, radiation at the outer surfaces of the transducers and interactions with the surrounding cell structure. Their magnitude depends on the individual resonator, its dimensions, materials and frequency range.
There is also a contribution that is not acoustic at all. Insufficient electrical shielding can produce electromagnetic cross-talk between the transducers, particularly at higher frequencies. In the analysis of the complex transfer function this contribution can be represented locally around a resonance by an additive complex term
Aelec · eiΦelec.
Thus the measured electrical response around a resonance may simultaneously contain the desired acoustic main mode, acoustic side modes and an electrical background. Extracting the liquid attenuation therefore requires fitting and separating these contributions rather than simply reading a linewidth from a spectrum.
THE REAL EXPERIMENTAL CELL
The resonator used in this work was a 1.1 MHz plan-concave resonator. Its slightly concave geometry influences the acoustic mode structure, while the mechanical construction provides precise alignment, temperature stabilization, filling and venting of the liquid volume.
The cell length was approximately 19 mm and the sample volume approximately 75 cm³. The resonator covered approximately 0.1–2.7 MHz and formed part of a family of resonators used to extend ultrasonic spectroscopy towards low frequencies.
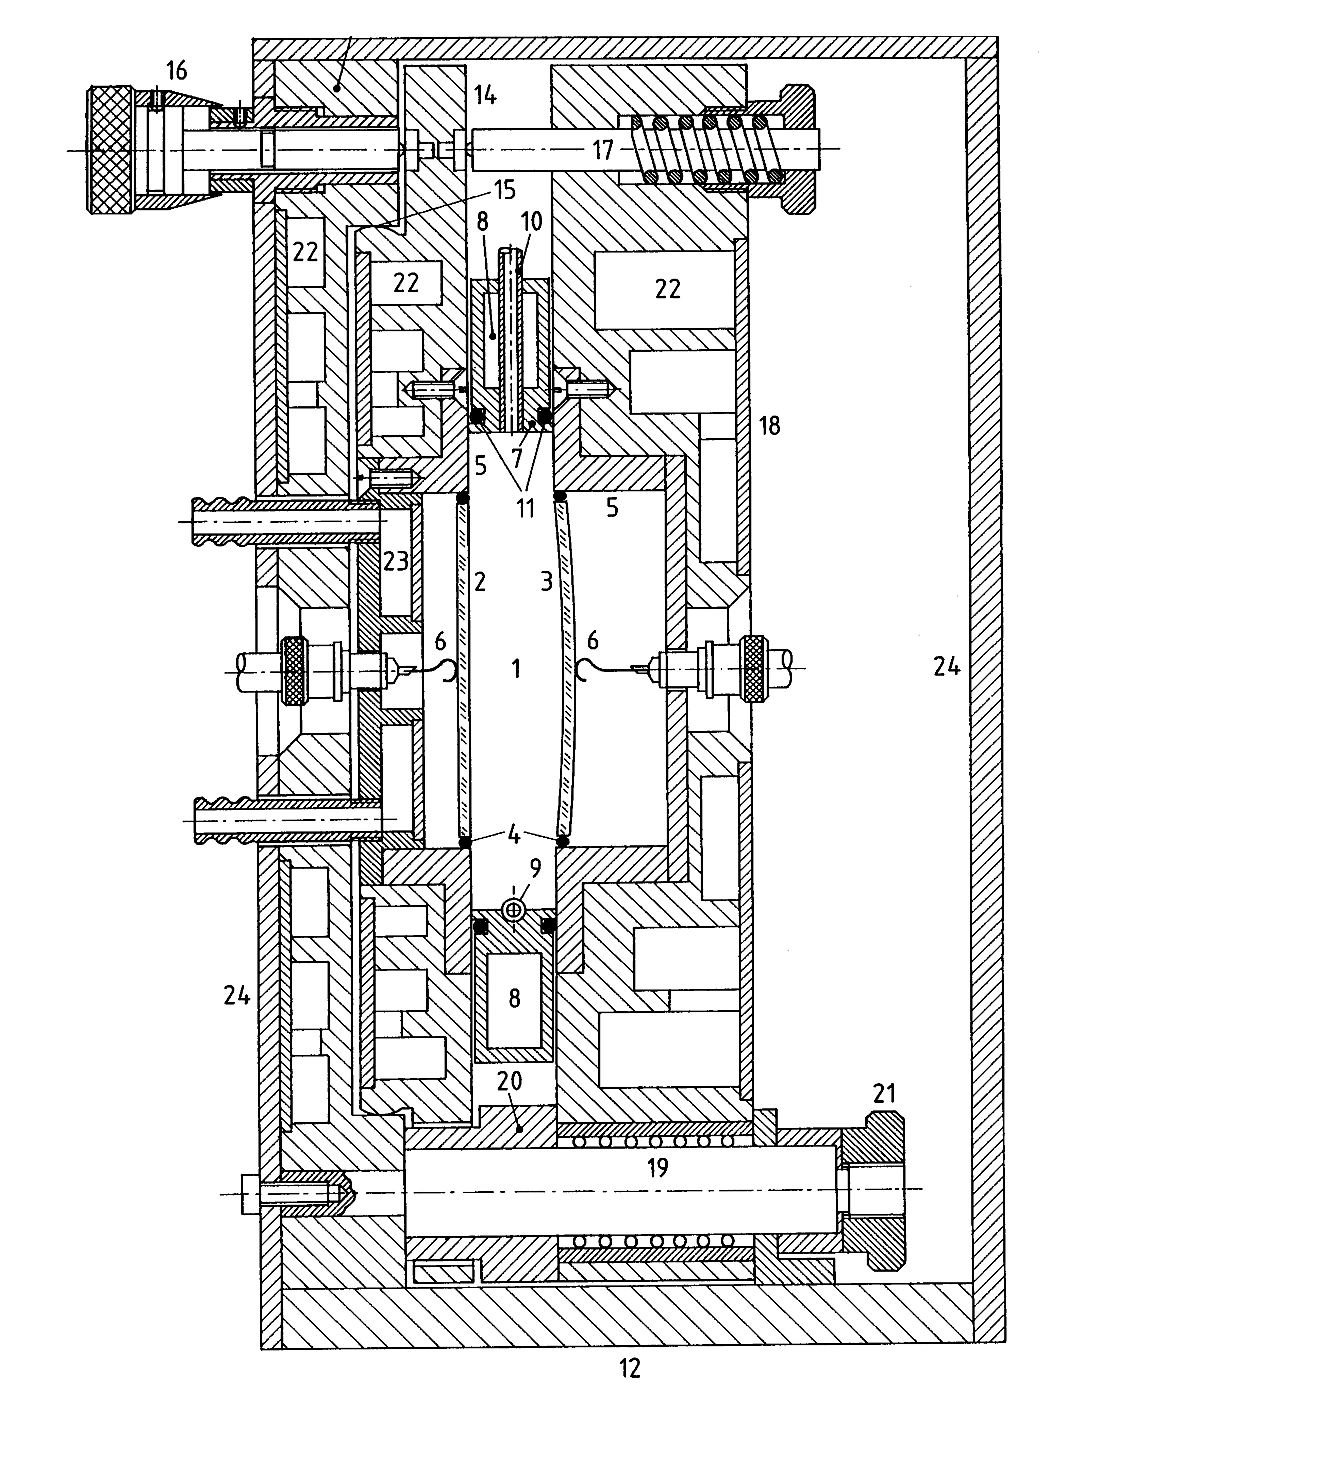
Components shown in the cross-section:
1 — measuring volume; 2 — planar transducer; 3 — concave transducer; 4 — bonded mounting with electrical contact to the liquid-facing side; 5 — quartz holder (V2A stainless steel); 6 — rear electrical contact; 7 — cell boundary; 8, 22, 23 — thermostat channels; 9 — filling channel; 10 — venting channel; 11 — sealing rings; 12 — base plate; 13 — transmitter-side mounting plate; 14 — tiltable frame for parallel adjustment; 15 — ball joint; 16 — fine-adjustment screw; 17 — compression spring; 18 — receiver-side mounting plate; 19 — ball guide; 20 — spacer for fixing the cell length; 21 — fastening screw; 24 — protective walls for thermal shielding.
REFERENCE MEASUREMENT — SEPARATING SAMPLE AND APPARATUS
The apparatus contribution cannot simply be calculated away from geometry alone. A reference measurement is therefore an essential part of the experiment. The reference liquid should reproduce the acoustic conditions of the investigated solution as closely as possible, in particular with respect to sound velocity cs and density.
This requirement is physically important. If the sound velocity were substantially different, resonance spacing and mode positions would change; different acoustic impedance conditions would also modify the interaction between liquid and quartz transducers. The reference would then characterize the resonator under different acoustic conditions from the actual sample.
For the measurements performed in this work, butanol served as the reference liquid. The measurement strategy can therefore be summarized as
sample spectrum → reference spectrum → apparatus contribution → corrected sample attenuation.
The reference measurement provides the experimental counterpart to the mathematical separation between measured attenuation and apparatus losses. It is what allows the acoustic fingerprint of the resonator to be distinguished from the physical response of the investigated liquid.
EXPERIMENTAL ACCURACY
The sensitivity gained by multiple reflections also makes the method sensitive to experimental details. Reliable measurements require reproducible filling and wetting of the cell, the avoidance of gas bubbles, stable and reproducible temperature conditions and careful fitting of resonances in the presence of side modes.
For the 1.1 MHz plan-concave resonator used here, the estimated relative uncertainty of the attenuation measurement was approximately 5–10 %.
This leads to a useful summary of the entire method: the resonator gains sensitivity by letting the sound interact with the sample again and again — but precisely this sensitivity also makes the experiment sensitive to the resonator itself.
FROM THE RESONATOR TO THE ULTRASONIC SPECTRUM
Resonator techniques are particularly powerful in the lower-frequency region of ultrasonic spectroscopy, where direct transmission measurements would require impractically long propagation distances. Different resonator geometries can cover complementary frequency intervals; the complete resonator family used in this experimental environment extended approximately from 15 kHz to 20 MHz.
At increasing frequency, however, acoustic attenuation rises and the experimental problem changes. A long effective propagation path is no longer an advantage. Instead, increasingly short and precisely controlled propagation distances are required to prevent the acoustic signal from being attenuated before it reaches the receiver.
The experimental strategy therefore changes from storing the sound between reflecting transducers to observing a wave travelling through a defined sample path.
This is where the resonator hands the experiment over to the pulse-modulated travelling wave.