2003-(II)-Ultrasonic techniques - The Resonator
Article Index
Ultrasonic technique is used to study fast elementary molecular processes in liquids. It is possible to study phenomena like stoichiometrically well defined chemical equilibria, including protolysis and hydrolysis reactions, conformational changes, association mechanisms and critical fluctuations. Oscillating compressions and decompressions in an ultrasonic wave cause oscillations of molecular arrangements in the liquid. An advantage of this technique is that the amplitudes of deformations in the ultrasonic waves are extremely small. It is a non-destructive technique. The available frequency range from 80 kHz to 5 GHz necessitates the use of different techniques: resonator methods and variable path length methods. However, this need provides another advantage of this methods. Because of different instrumental set-ups, systematic errors are unlikely to remain unnoticed.
Example of Ultrasonic Measurement Set-Up: "Resonator"
Classical absorption and background contribution:
Sound fields constitute temporal and spatial oscillations of the local pressure, which propagate through the liquid medium adiabatically, with its amplitude decreasing exponentially along the direction of propagation z by:
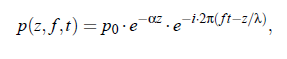
where α is the attenuation coefficient, cs is the sound velocity in the liquid for compressional waves of frequency f , cs = λ ·f , p is the sinusoidally oscillating sound pressure, p 0 = p (z = 0) and i2 = −1. The attenuation coefficient α is usually considered in ultrasonic spectroscopy. For our understanding of acoustical spectra, it is necessary to identify the physical mechanisms leading to sound attenuation in liquid systems. Oscillations of the liquid are coupled to the shear viscosity and other transport properties, which thus play an important role in compressional wave interactions. If the particle velocity is smaller than the sound velocity, the field in a viscous liquid is determined by the Navier-Stokes equations resulting in an acoustic absorption coefficient. An expression, which describes viscosity losses, is:
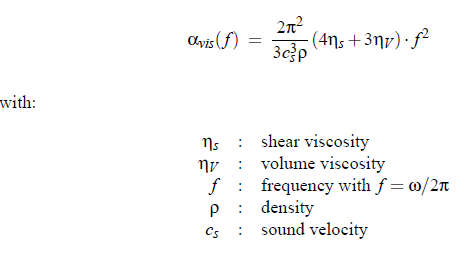
The relation (3.28) is strongly dependent upon the properties of the medium and on the frequency. Here the properties of a medium are mainly defined by the shear and the volume viscosity. Shear viscosity has the origin in Stokes friction. Additional losses result from the thermal conductivity, which has been fist shown in 1868 by Kirchhoff:
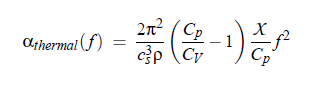
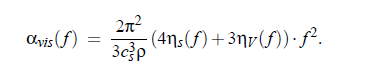
From history, it is a common practice to call the sum αvisc + αthermal as the ”classic” part of the acoustic attenuation coefficient αclass . In aqueous solutions the α_thermal contribution part to α_class is usually small (α_thermal α_vis ) and can be neglected. In principle the the shear viscosity ηs and the volume viscosity ηV in Eq.(3.28) are frequency dependent quantities. Therefore:
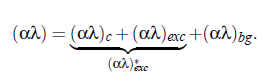
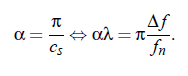
However, it is convenient for the discussion of measured acoustical spectra to assume the frequency-independent asymptotic ”background contribution” B , characterizing the total absorption at frequencies far above the experimental range. This includes the relaxation processes, occurring at frequencies well above the measuring range. Subtracting the asymptotic value from the measured absorption gives the so-called excess contribution (α/f 2 )exc and the excess absorption per wavelength (αλ)exc :
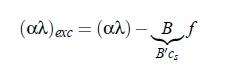
Noncritical ultrasonic excess absorption:
Fast elementary molecular reactions, that are usually exhibited by ultrasonic excess absorption spectra, with the inverse relaxation time in the frequency range of measurement, are conformational changes, protolysis and hydrolysis, as well as dimerization and complexation mechanisms. Chemical equilibria are associated with Debye-type relaxation terms, exhibiting discrete relaxation times τ. The excess absorption for one relaxation process can thus be described by:
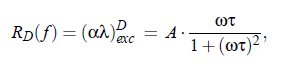
with ω = 2πf , and A being the relaxation amplitude. Let X and Y represent different conformers of the same species in a dynamical equilibrium. The unimolecular reaction scheme is then simply given by:
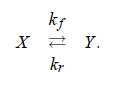
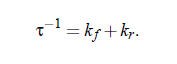
Here kf denotes the forward rate constant and kr represents the reverse rate constant. Both constant are related to the equilibrium constant K = kf /kr and to the relaxation time by:
In order to discuss some general characteristics of ultrasonic relaxation, an energy scheme is sketched in Fig.(3.4), where a (hypothetical) potential is given as a function of the molecular volume of the species undergoing a boat/chair conformation equilibrium like that of cyclohexane:
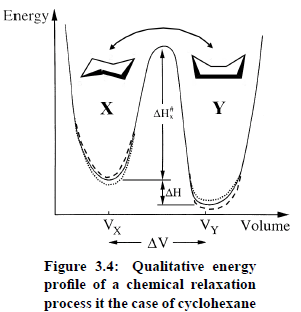
In Fig.(3.4) it has been assumed that the species X and the species Y differ from one another by the molar reaction volume:
and by the reaction enthalpy ∆H . In principle, the idea of getting information about α_exc is simple. In a sound field, the energy profile oscillates around the equilibrium curve, as indicated by the dashed and dotted curves in Fig.(3.4). The autocorrelation function for thermal fluctuations of the population numbers NY (t) and NX (t) of species Y and X , repectively, in a given volume element and thus the autocorrelation function of the thermal fluctuations in the density ρ of the sample is characterized by an exponential decay:
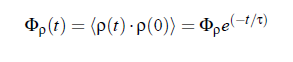
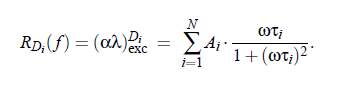
with the autocorrelation time τ. The liquid system tends to follow the oscillations in the potential curve. The transition from one conformation to another is controlled by the activation enthalpy barrier ∆H > RT , establishing a finite probability for that conformational change. In accordance with the Le Chatelier principle it follows the reaction.A time lag between pressure and density in the sound field leads to a dissipation of acoustic energy with an attenuation coefficient α. At f (2πτ)−1 the system has sufficient time to reach the equilibrium without significant decay. At high frequencies f (2πτ)−1, the system can not follow the rapid pressure variations. In the frequency range f ' (2πτ)−1, sound energy dissipation per cycle has a maximum, leading to the characteristic profile of Debye term. The unique Debye term fits spectra pretty good in case of well defined molecular processes. Sometimes it is not possible to describe an excess absorbtion spectrum by one Debye term. Especially, when different molecular processes exist in the frequency range of measurement it is mostly necessary and possible to apply a sum of Debye terms:
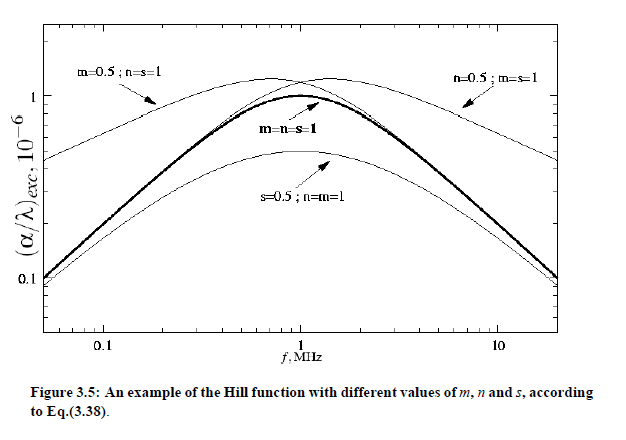
Unfortunately, sometimes molecular processes lead to very complicated spectra; sequently, they can only be regarded as a sum of Debye-terms with a particular distribution of amplitudes. Menzel at al. found the relaxation spectral function, originally introduced by Hill, discussing non-exponential decay in the polarization of dielectrics, to be favorably utilized in physical acoustics. The Hill function is given by:
where A denotes an amplitude. The Equation reflects an underlying continuous relaxation time distribution with a characteristic relaxation time τ and with parameter m,n and s ,(0 ≤ m,n,s ≤ 1), that determine the width and the shape of distribution function. If m = n = s = 1 then the Hill spectral function corresponds with a Debye term. bold plot in Fig.(3.5). With a reduced number of adjustable parameters the restricted Hill function:
is then appropriate.
Critical systems and total attenuation spectrum:
In the case of critical liquid systems, the ultrasonic spectra get an additional contribution, resulting from the critical fluctuations. This critical attenuation term has been treated within the framework of the Bhattacharjee-Ferrell theory. Assuming additivity of the critical contributions and the other ones, the total ultrasonic absorption spectrum, can be written as:
However, because of its essential role in these investigations, the first contribution of the eqaution will be treated separately in the Project (2003-(III)-Critical Contribution, Dynamic Scaling and Crossover Theory ).
Ultrasonic instruments:
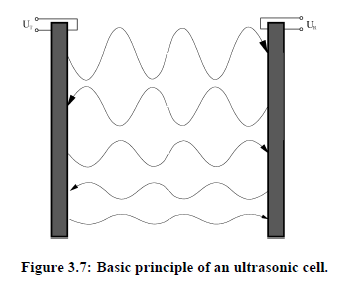
The ultrasonic cell consists of two piezoelectric transducers arranged parallel to each other. One of these disc-shaped transducers acts as the transmitter, the other one as receiver. The surfaces of the used transducers are coaxially plated with electrodes (chrom/gold). The soundwave is induced by the inverse piezoelectric effect.
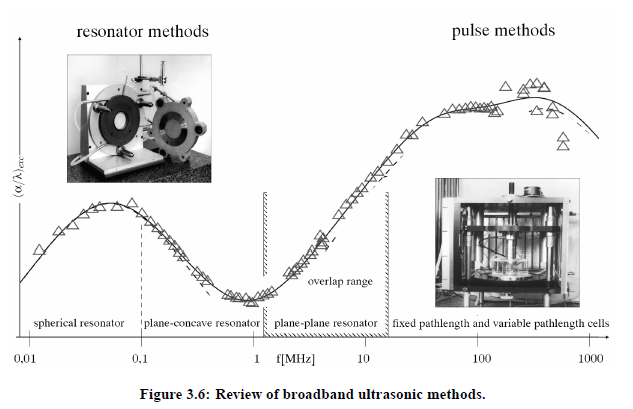
In principle two kinds of ultrasonics techniques were used in present project; the resonator method and the pulse transmission method. The principle of the resonator method is based on folding the acoustic path via multiple reflections in order to obtain a resolvable amplitude decay at lower frequencies. With the help of pulse methods it is possible to make measurements of the exponential amplitude decay versus distance of propagating waves, which propagate through the liquid. Standing and the traveling wave methods overlap in a wide range and can be used to check the consistency of measured ultrasonic spectra.
Resonator cells 80 kHz - 20 MHz:
The ideal resonator
In order to understand the functioning of a real resonator, it is appropriate to take a look at the ideal resonator. In this work cylindrically shaped ultrasonic resonator cavities are operated in compressional modes. For the consideration of an ideal resonator some assumption have to be made. First, the ideal resonator consists of two piezoelectric planar transducers, separated by the distance l and with radius R . The wavelength of the sound waves is λ << R . As a consequence, plane waves are considered. Second, energy dissipation occurs only in the fluid.
Because of these assumptions it is possible to express the sound pressure at the receiver as a mathematical series:
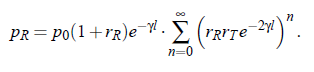
This series convergences for rR·rT < 1. With p T (0,t ) = p_ 0 ·eiωt this yields:
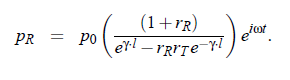
Finally, the transfer function T(f ) results as proportionality:
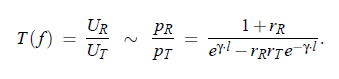
Its absolute value is:
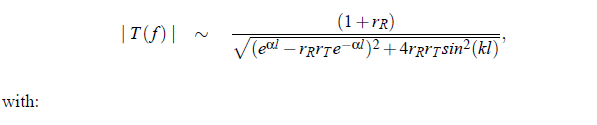
(index R denotes the receiver and index T the transducer)
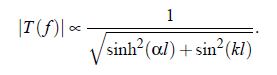
The transfer function for an ideal resonator with reflection coefficients at the liquid transducer interfaces rR = rT = 1:
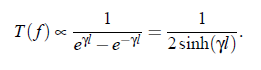
With the relation sinh (γl) = sinh (αl) + sin (kl ), the amount of T (f ) is given by:
Consequently, for the ideal resonator equidistancy of resonance frequencies follows:
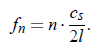
With the aid of the sound velocity of cs can be determined. For smaller losses, (α 1) Eq.(3.46) can be calculated with the use of Taylor series, at the resonances f n . For f = f n + δf the original value leads to the relation:
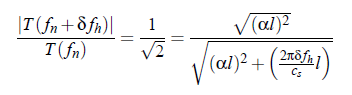
for the sound pressure. Consequently, the relation between the attenuation coefficient α and the half-power bandwidth ∆f = 2δf h follows as:
The real resonator:
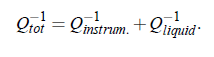
Quality factor the real resonator: In a real resonator, however, acoustic energy is not only dissipated by the liquid sample but also by imperfections of the cell. Among the various mechanisms is energy dissipation caused by diffraction of the sound wave due to the finite cell diameter. Furthermore, the radiative energy losses at the back face of the quartz, have also to be taken into account. The quality factor Q of a resonator is defined, by the ratio of reversibly stored energy and the dissipative energy. In summary, there are two contributions to the energy dissipation of a sound beam: attenuation caused by the liquid and that from the instruments. The total measured reciprocal quality factor can be written as:
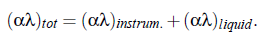
Because the quality factor Q is connected with the half-power bandwidth ∆f via: Q = f n /∆f and because of Eq.(3.50) the total attenuation per wavelength, can be expressed by:
Labhardt et al. have found a relation for losses of plane transducer resonators:
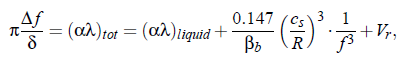
where βb = ZL /ZT , with the specific impedances of liquid ZL and transducer ZT. The second term on the right-hand side of the equation describes losses caused by diffraction of the sound beam, while V_r additional losses. However, it is not possible to analytically separate all instrumental loss contributions during measurements. Owing to this, it is necessary to perform a reference measurement, with a carefully chosen reference liquid with matched sound velocity and densit.
Transducer properties:
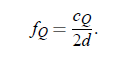
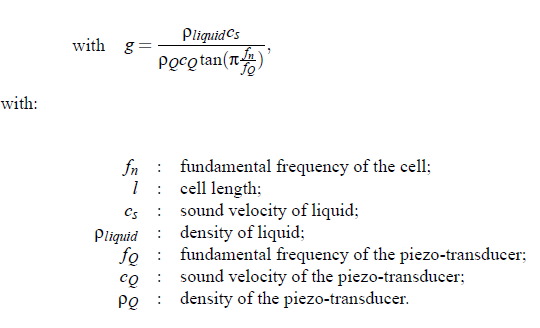
The resonances of the transducer can be expressed by the sound velocity of the transducer cQ and its thickness d:
There is a finite liquid-to-transducer acoustical impedance ratio so that the sound can penetrate into the transducer. Caused by this effect, the cell-length ”seems” to be larger than the geometrical length. This effect becomes more important near the fundamental transducer frequency and its overtones. The cavity resonances are no longer equidistant. This behavior has been calculated by Labhardt, too:
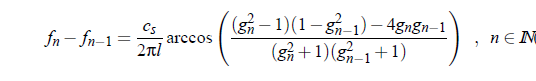
In order to consider the influence of transducer resonance on the resonator transferfunction, a piezo-transducer transfer function E (f) has to be taken into account. Eggers and al. have proposed the function:
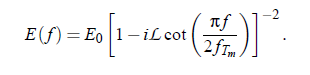
Here L is a factor, depending on the acoustic load and f T_m = f Q · m with m = 1,2,...,n.
Higher order modes:
At increasing frequency f and increasing attenuation coefficient α of the sample liquid, the resonances belonging to a principal mode of vibration of the cavity, will be more and more distorted and disturbed by undesired satellite peaks. The following equation expresses this behavior for the so-called biplanar-resonator:
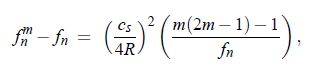
where f n denotes the frequency of the n-th principal mode, R is the cell radius and m is the number of the higher order satellite modes belonging to n mode (m = 1: principle mode). The distance between the resonance peak of a principle mode and a satellite peak depends on the geometry of the transducer. For the plano-concave resonator, with focussing effect of concavely shaped face of the circular cylindrical cavity resonator, follows:
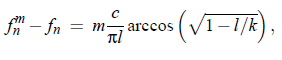
with k = radius of curvature of the concave face. Plano-concave resonator have been also used in this work (k = 2m). A favorable feature of such devices is the reduction of disturbances from mechanical stress during temperature variation, due
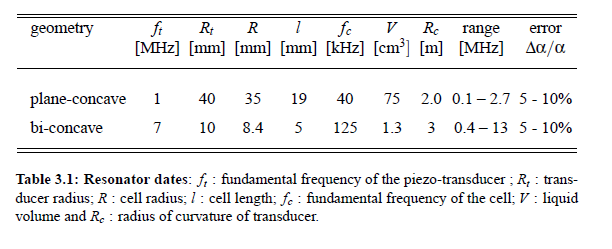
to the focussing effect. Other errors typical for measurements are caused by temperature fluctuations (change of c_s ), by changes in the geometrical dimensions of cell (due to cleaning, emptying or refilling procedures), errors of electronic equipment, especially of the impedance analyzer used for the transducer function measurements, and systematic errors due to insufficient parallel adjustment of the transducer crystals. In Table (3.1) one can find the instrumental data for relevant resonators of the present work and also some experimental errors:
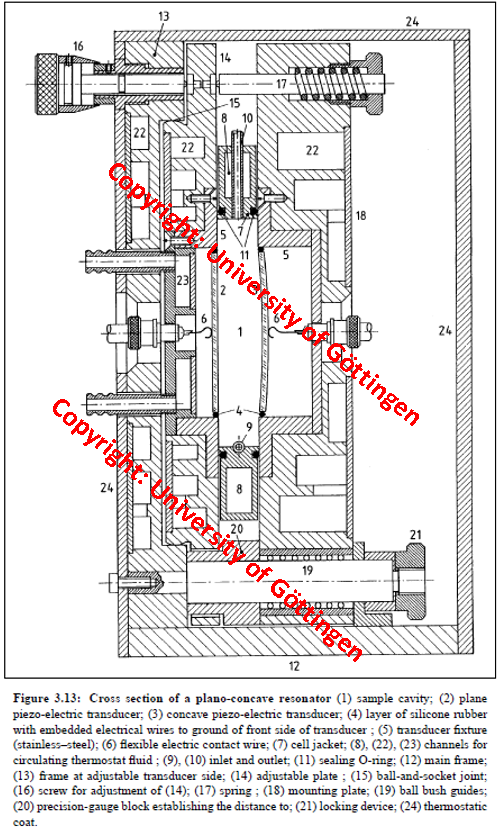
Cell design of a resonator: The cross section of an ultrasonic resonator cell
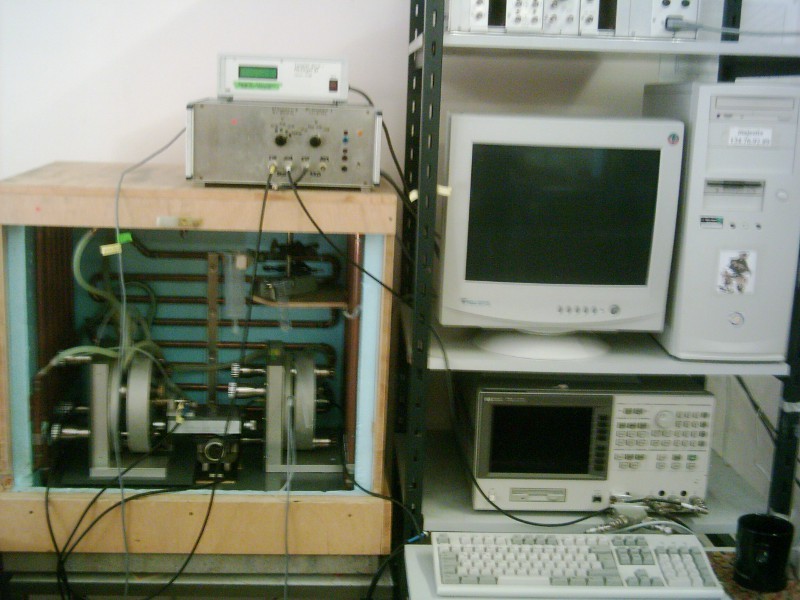
Electronic equipment:
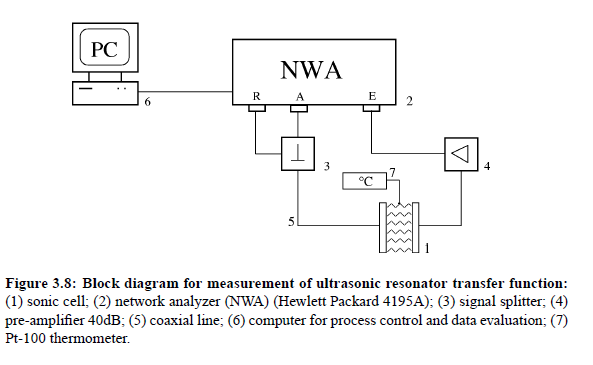
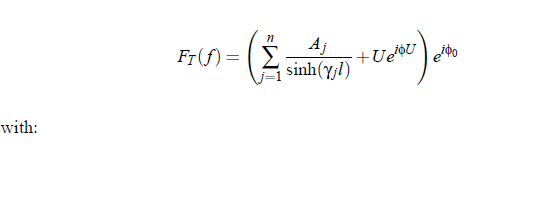
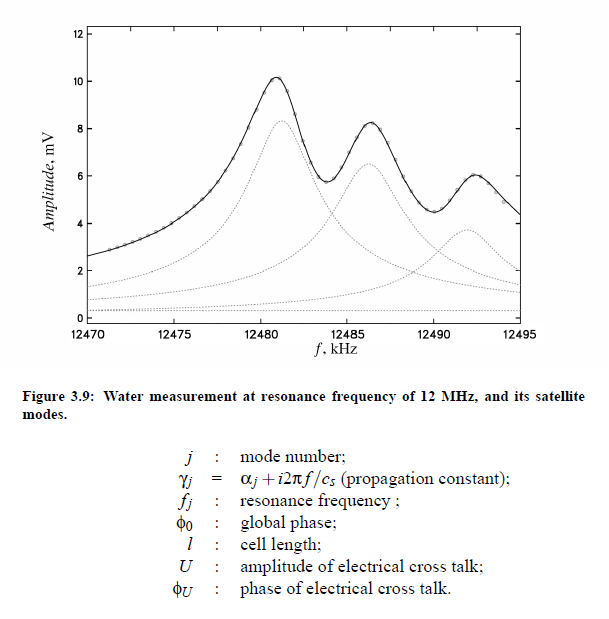
Fig.(3.8) shows a block circuit for broad-band resonator measurements. With the aid of a commercial network analyzer it is possible to measure the transfer function with high accuracy. In addition, a RF pre-amplifier, matching the high-impedance transducer output to the NWA input has been used. Furthermore, applying a computer for control of the network analyzer (NWA) and the amplifier and for the data evaluation, enabled automatic measurement routines. As presented in Fig.(3.9), the resonator transfer function can not be described by one Lorentz function. Therefore a fitting procedure of the transfer function is performed with the aid of a function, which allows to fit, beside the principal mode, the satellite mode as well as the electrical cross talk: