2018-(II)-Surface Tension in Critical Mixtures
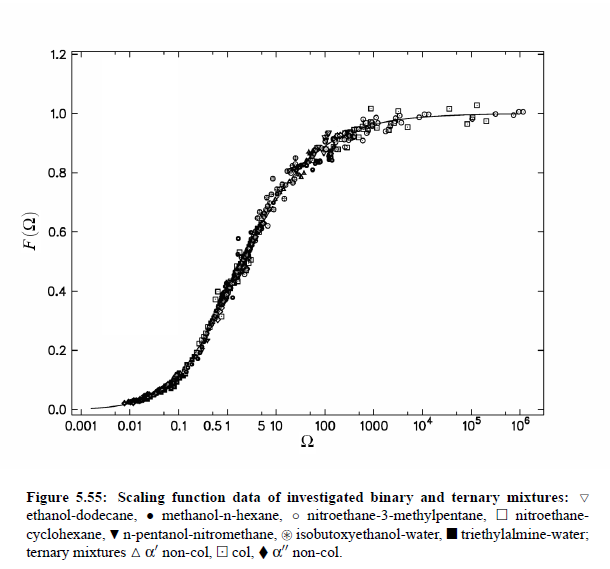
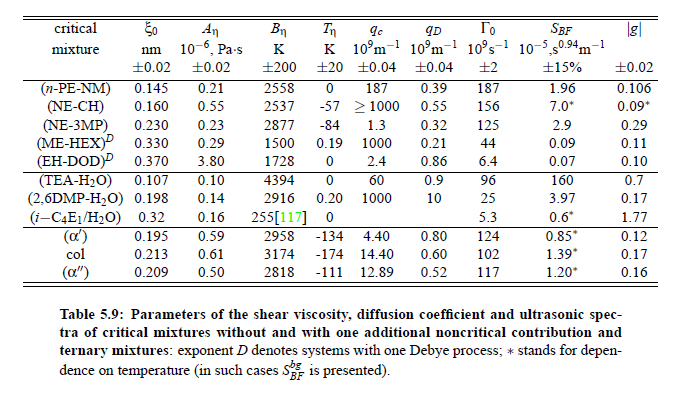
Parameters which have been obtained from ultrasonic spectrometry, dynamic light scattering and shear viscosity are presented in Table (5.9). It is a fascinating aspect of the dynamic scaling theory of ultrasonic attenuation that, due to scaling of frequency data of different critical mixtures fall on one scaling function. However, the most curious specific system parameter is the characteristic relaxation rate amplitude Γ_0, which according to Bhattacharjee-Ferrell theory, corresponds with the mutual diffusion coefficient D and the fluctuation correlation length ξ. In Table (5.9) parameters Γ_0 and ξ_0 are listed for various binary mixtures with critical demixing point. The isobutoxyethanol-water system exhibits by far the smallest amplitude Γ_0 in the relaxation rate of order parameter fluctuations. In comparison, with the system n-pentanol-nitromethane, Γ_0 is 35 times larger. Assuming, that the life time of fluctuations τξ = Γ_0^−1, as inverse characteristic relaxation rate reflects intermolecular properties as well the geometry of considered components the strong variation of Γ_0 of various liquids can be understood. In addition, due to the Coulombic interactions, relaxation from a local nonequilibrium distribution of electrical charges into thermal equilibrium will involve extensive redistribution of ions in ionic solutions and may, therefore, proceed with a smaller relaxation rate than a molecular liquid mixture at the same reduced temperature. A quantity, which may be taken to summarize the above mentioned molecular properties, is the surface tension σ. If considering critical fluctuations, reflected by the fluctuation relaxation rate Γ_0 , to depend on the surface tension, a correlation between both quantities should exist.
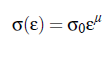
Based on this idea, Khabibullaev and Mirzaev found a correlation between sound attenuation and surface tension. One of the most important parameters in the determination of the characteristic relaxation rate is the viscosity. The first relation between surface tension and viscosity, has been presented by Pelofsky [149] as a relation between these two thermophysical properties:
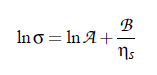
where A and B are constants, σ is the surface tension, and ηs the viscosity. According to this equation, this empirical expression can be applied for pure and mixed components. Several fluids were shown to follow these relations: n-alkanes, benzene, toluene, xylenes, phenol and other aromatics, n-alcohols in the range, water and some aqueous solutions.
Finally, we have an additional indication for correlations between surface tension and mutual diffusion coefficient, and consequently between mutual diffusion and the fluctuations correlation time. However, it has long been known from experiment that ∂σ/∂x = 0 (x denotes composition) at the critical poin in binary mixtures. Theory predicts more specifically that, as the critical point is approached, the surface tension σ as function of reduced temperature ε, vanishes according to power law with an critical exponent µ:
The critical exponent µ, is related to the correlation length exponent ν, by the Widom scaling law:
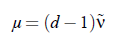
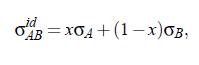
in which d is the spacial dimension of the system. Unfortunately, it is not possible to find for all considered systems experimental literature data of σ, probably, due to experimental problems in the determination of this quantity:

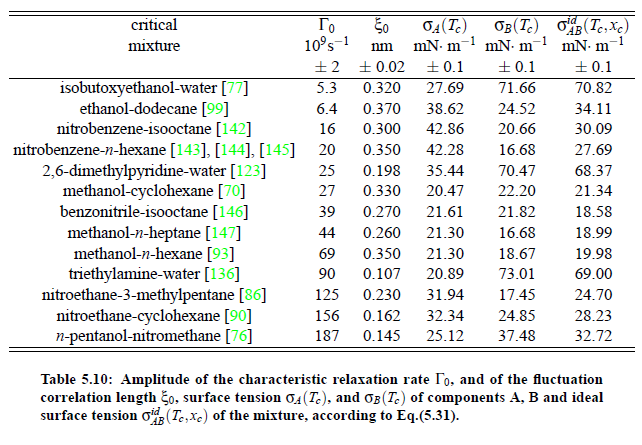
here A , B denote the components and x the mole fraction (x = x_c) at critical composition. Surface tension data for pure liquids of all components of binary mixtures presented in Table (5.10) have been found in the literature [Dewan R. K., Mehta S. K.; Chemical Monthly Springer (1990) B28 (1935) 119], where for every component the surface tension of four temperatures is listed. Values at temperatures between the tabulated ones could be obtained by linear interpolation with an error of less than ±0.02 mN/m. Taken into account the critical temperature of a mixtures as well as using the last equation the surface tension σ_id has been calculated, Table (5.10):
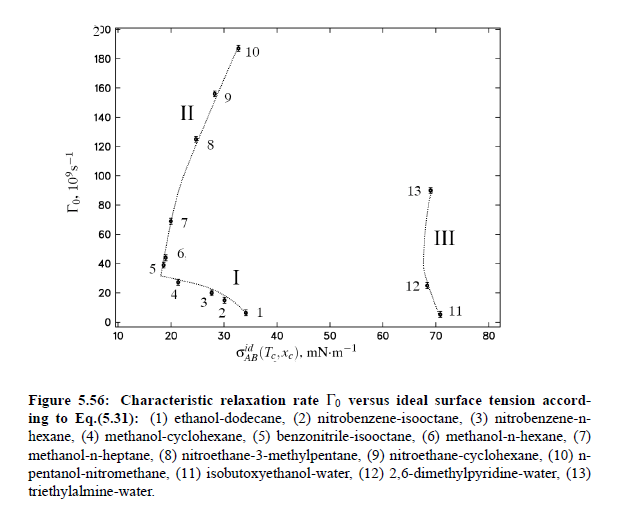
In order to perform qualitative studies of a correlation between characteristic relaxation rate and the surface tension, both quantities have been plotted against another in Fig.(5.56). Unfortunately, the data points do not represent any analytical behavior. Nevertheless, the plot displays three groups of binary critical systems. Group (I) represents binary mixtures, where the characteristic relaxation rate decreases with increasing surface tension, while group (II) displays an opposite trend. The third group (III) shows the behavior of binary aqueous solutions, with by far the largest surface tension. However, this kind of qualitative studies give an indication that there must exists an additional parameter which interacts additionally with the surface tension. In fact it has been argued by Fisk and Widom and recognized later as an aspect of the tow-scale factor universality that there exists a universal combination of critical amplitudes involving the surface tension amplitude σ_0, [Fisk S., Widom B.; J. Chem. Phys. 50 (1969) 3219]. According to Brezin [Brezin E., Shechao F.; Phys. Rev. B 29 (1984) 472], the simplest way to define the universal combination is to notice that the free interfacial energy per unit area (divided by k_CB T_c), multiplied by an area as defined by the correlation length, is both temperature independent and universal in the vicinity of T_c. Owing to this argument, the following expression can be written:
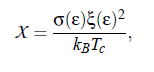
where X = 1/4 ·πk and k is a dimensionless quantity between 1.39 and 1.57 from theory, kB , is Boltzmann’s constant and ε is the reduced temperature. However, it was also reported in [Brezin E., Shechao F.; Phys. Rev. B 29 (1984) 472], that k lies in the interesting range between 0.5 and 2.00. The last equation plays a key role in understanding the nature of critical wetting and it is likewise a powerful expression, which connects the surface tension and fluctuation correlation length. However, using the same surface tension values, calculated with the aid of:
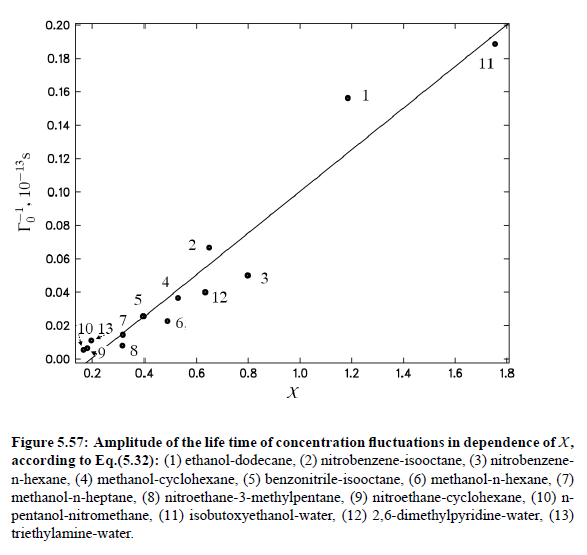
the dependence of the characteristic relaxation rate Γ_0 , and accordingly the life time of fluctuations could be studied as a function of the correlation length as well as surface tension. In fact the qualitative plot of life time of fluctuations Γ_0^−1 demonstrates a linear dependence on quantity X Fig.(5.57). Once more it should be underlined, that this are only qualitative studies.