2004-(I)-Ultrasonic techniques - Pulse-modulated traveling wave methods
Pulse-modulated traveling wave methods:
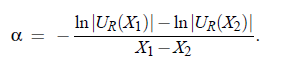
At frequencies above 3 MHz the distortion of resonator curves by higher order modes may be so strong that the separation of the satellite peaks from the main resonance curve becomes impossible. However, the simple proportionality, given by the expression:
allows to measure quasi-directly the sound attenuation coefficient α. Pulse-modulated measurement are performed at the transducer fundamental frequency and its odd overtones which follow the (2n + 1) ·f T -law. The shiftable receiver, as shown in Fig.(3.10), at the position X 1 detects the acoustical signal and transfers this into an alternating voltage U_R( X_1). At the position X_2 the alternating voltage U_R (X_2) is received. Hence, the attenuation coefficient α follows as:
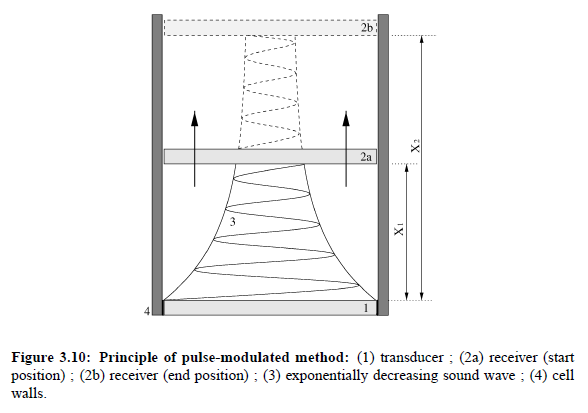
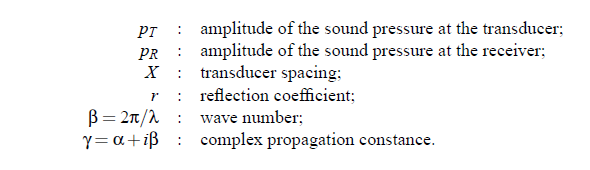
Pulse modulation of the sound wave avoids overlaps between the original signal and multiply reflected signals as well as the electrical crosstalk. At small transducer spacing, so-called acoustic delay lines (fused quartz) are used for pulse separation. The pressure amplitude p_ R of the sound wave (taking into account multiple reflections) can be expressed as:
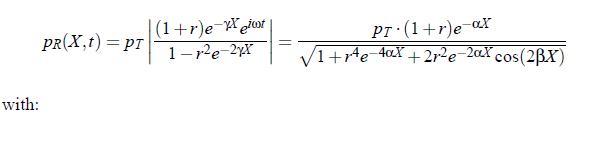
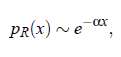
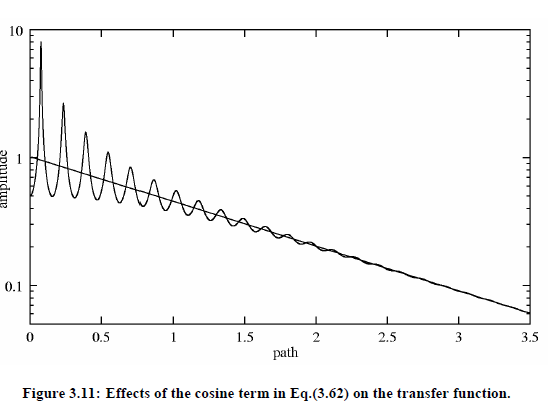
The cosine function of the transfer function describes the so-called λ/2-ripple, caused by the multiple reflections of the signal at the transducers. For αλ > 3 the denominator of previous equation equals approximately 1, so that an exponential decay of the sound wave p R ∼ e−αX follows. In Fig.(3.11) a plot is given as an example. It illustrates that at decreasing sample length X the standing wave contributions of the ultrasonic field within the cell become more and more important.
fitting at a given frequency f; to experimental data yields the absorption coefficient α and the sound velocity cs = λf of the sample liquid. To raise the accuracy of α measurements it is usual to reduce the influence of the cosine function. This can be realized with the help of the pulse modulation as mentioned before. The transducer signal is pulsed with the aid of square-wave pulse, with the pulse length following the relation:

τ = 2 − 10 µs. From this relation it is evident that the knowledge of the sound velocity cs of the liquid sample is essential for correct pulse adjustments.
Sound velocity measurements:
The transducer and the receiver have to be brought to a distance fulfilling X < τc/2 or X < 3/α. At the range of 20 · λ, the transfer function is measured and the experimental data at constant frequency are fitted. Finally, with the help of cs = λ ·f , the sound velocity cs can be calculated.
Characteristic curve of electronic setup:
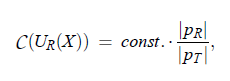
The accuracy of pulse methods depends on the accuracy of determining the characteristic curve of the electronic equipment. In the measurement mode the signal passes some electronic devices. At first, the voltage U_R has to be demodulated and amplified. Unfortunately, non-linear effects in the electronic circuit, especially in the amplifier exist. Hence, the voltage U_R is subject to the characteristic curve of the receiver C (U_R) and the sound pressure amplitude at the receiver quartz:
Finally, it is possible, with the aid of linear regression to calculate the attenuation coefficient as given:
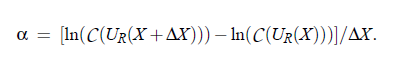
Here ∆X is the measurement distance. A central role in the determination of the characteristic curve of the electronic equipment plays the cut-off piston attenuator. Calibration of the apparatus is performed after each run by switching from the measuring branch to the reference branch and utilizing the cut-off piston attenuator to vary the receiver voltage.The voltage characteristic obtained by this calibration procedure allows the correction of the originally measured U_R values.
Electronic equipment and measuring procedure: A block diagram of the electronic apparatus is shown in Fig.(3.12).
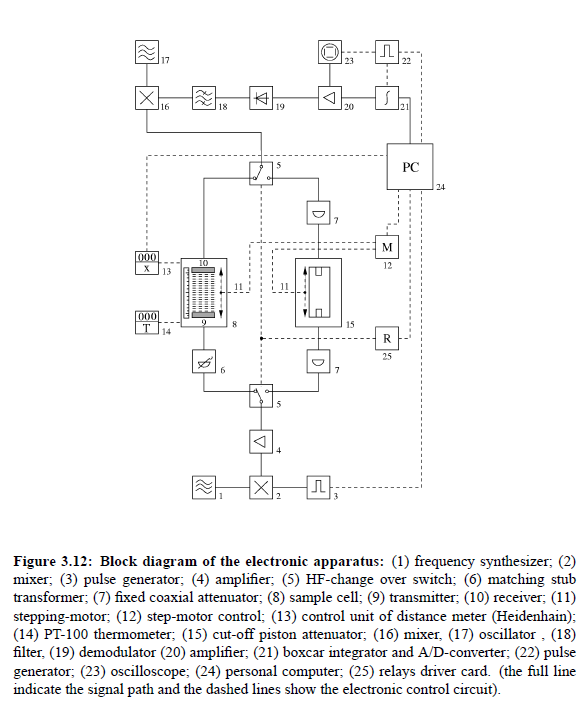
The full lines ndicate the signal path and the dashed lines show the electronic control circuit. The frequency synthesizer (1) along with the pulse generator (3) and the mixer (2) generates a pulse-modulated HF signal with frequency of measurement f. The signal, via two coaxial HF-switches, is passed either through the measuring branch or the reference branch of the comparator circuit. After passing the sample cell or the below-cut-off piston attenuator, both signals are fed via HF change over switch (5) to a superheterodyne receiver (16-20). A boxcar integrator (21) adds up the signal over a sequence of 400 pulses. Finally, the result is transferred to a personal computer and evaluated using the data of length l, measured by the digital distance meter (11) with control unit (13). The temperature is measured with a Pt-100 thermometer (14).
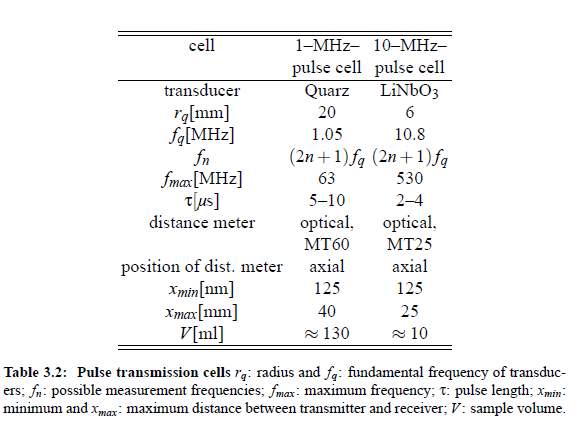
Pulse cell parameters:
Some relevant data of the cells are tabulated in Table (3.2).